


(TheNewswire)

|
|||||||||

|

|

|
|||||||
Inversion Modelling of Geophysics with Drill and Soil Data Creates Excellent Targets
For Immediate Release
-
Multiple high-grade intersections across many historic drill holes with highlights: 62.1m of 1.02% CuEq and 71.5m of 0.80% CuEq
-
Coincident low magnetic areas, high chargeability zones, and copper-molybdenum-silver in soil anomalies define large high-quality targets.
-
Modelling geophysics and drill hole data in three dimensions outlines compelling high grade trends with untested, open-ended extensions.
Vancouver, British Columbia – February 26, 2025 – TheNewswire - Cascade Copper Corp. (CSE: “CASC”) (“ Cascade ” or the “ Corporation ”) is pleased to announce it has completed a compilation of historic drill data and integrated this with Inversion Modelling of geophysics into a three dimensional database from the 90% owned, 2,789 hectare Copper Plateau Porphyry project (the Project ) located in south-central British Columbia, Canada. The modelling has included all historic and recent data and the results indicate obvious and compelling targets as well as areas that will require further ground-truthing work before drilling is initiated.
Shannon Baird, Cascade’s Vice President of Exploration remarks “The exercise of putting the historic and modern work together in one database has paid dividends, as it has revealed not only some very high-grade drill intersections from the historic data, but also a number of highly predictive target areas suitable for immediate drilling as well as areas where further exploration is warranted and will be followed up.” He continues” To me, it is the perfect recipe for high quality targets; having coincident high chargeability, low magnetic intensity, and significant surface soil anomalies along strike and adjacent to numerous copper rich drill intersections displaying the same signature. Moving forward, we believe this formula will be crucial in future copper porphyry discoveries across the extent of the project area.”
Cascade Copper will host a live interview to discuss this release on Thursday February 27 at 12:00 ET. Please click here to register for the event.
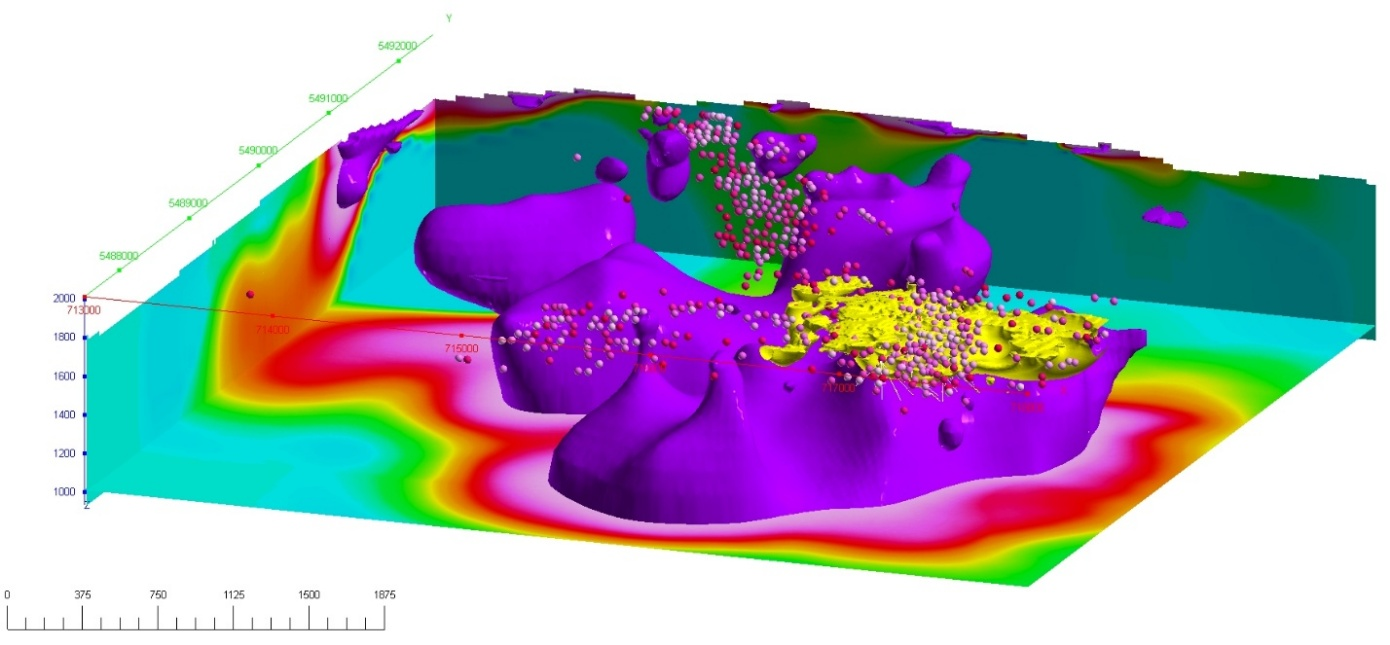
Click Image To View Full Size
Figure 1: Isometric 3-D view looking northwest showing the magnetic inversion model (magenta), 20mV/V IP Chargeability isoshell (yellow), and copper in soil (>150ppm) as coloured spheres.
Project Location
The Copper Plateau Porphyry project is located in south-central British Columbia, between Penticton and Princeton. It is situated south of the former Brenda Copper Mine, which produced 177 million tonnes of ore grading 0.169% Cu and 0.043% Mo between 1970 and 1990 3 . The geological setting is within the Quesnel Terrane which hosts Copper Mountain (1.13Bt @ 0.22% Cu, 0.09 g/t Au, and 0.64 g/t Ag Resource 2 ) about 40km southwest of Copper Plateau and Teck’s Highland Valley Copper Mine (M&I 1.2Bt @ 0.28% Cu and 0.009% Mo Resource 1 ). Kodiak Copper’s MPD project lies 40km west of the Project.
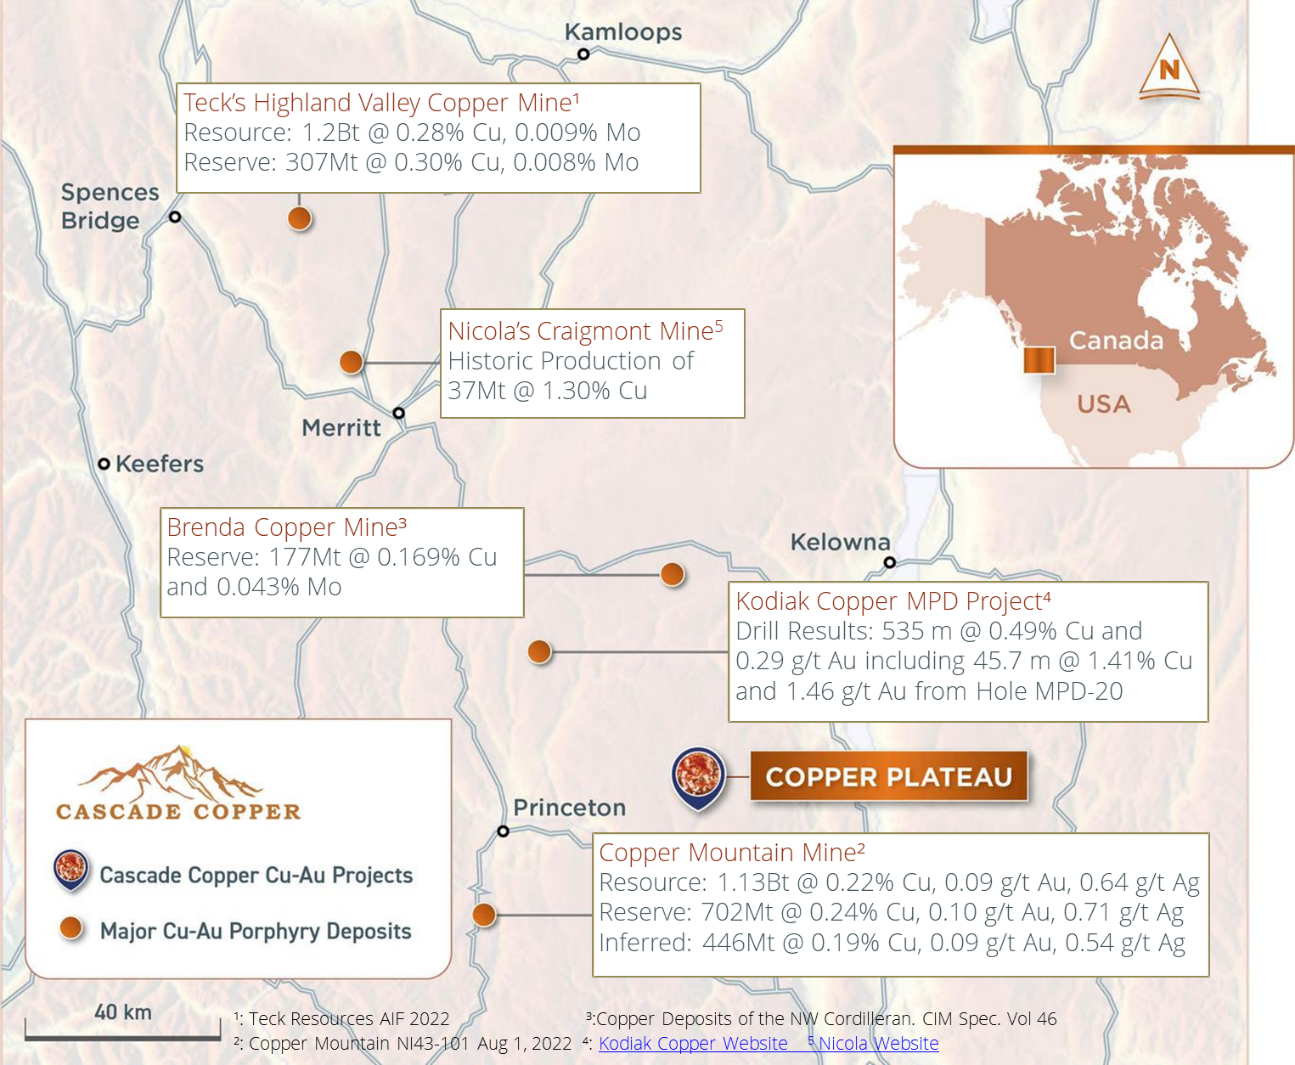
Click Image To View Full Size
Figure 2: Location of the Copper Plateau Copper-Moly Project in South-Central British Columbia
Drill Hole Compilation
Cascade has completed a full compilation and evaluation of the historic drill data at Copper Plateau and has reviewed the multi-element results in 3D. The highlights of the better intersections are included in Table 1 below. The take-away from this exercise is that there is appreciable mineralization in 97 of the 99 historic holes drilled at Copper Plateau and the mineralization is consistent across wide intervals mainly beginning at surface. For example: Hole IS08-39 intersected 0.29% CuEq from 2.65m to 305.7m for a total of 303.05m, and similarly Hole IS08-45 returned 0.23% CuEq from 2.86m to 375.27m for a total of 372.41m. Within these wide intersections of mineralization are high-grade sections with numerous intervals above 1% CuEq. For example, Drill Hole IS08-38 intersected 1.02% CuEq from 24.14m to 86.23m for a total of 62.09m.
Perhaps even more significant is the observation of high grade intercepts in some of the deepest holes drilled to the southeast through the main deposit. Figure 3 shows a cluster of greater than 1% copper equivalent intercepts near surface, but also shows a number of greater than 1% intersections at depth. Note that there are only a couple of holes drilled to the southeast at depth at a wide spacing leaving plenty of room for expansion.
Table 1: Copper Equivalent and associated individual element assays for high grade zones at depth in the eastern down-plunge section of the main mineralized zone at Copper Plateau*
|
Drill Hole |
From (m) |
To (m) |
Length (m) |
CuEq (%)* |
Cu (%) |
Mo (%) |
Au (g/t) |
Ag (g/t) |
|
|
IS06-07 |
3.66 |
276.40 |
272.74 |
0.20 |
0.07 |
0.014 |
0.018 |
0.64 |
|
|
Including |
15.84 |
86.32 |
70.48 |
0.32 |
0.12 |
0.023 |
0.024 |
1.05 |
|
|
Including |
63.40 |
86.32 |
22.92 |
0.63 |
0.18 |
0.053 |
0.042 |
1.71 |
|
|
Including |
63.40 |
66.44 |
3.04 |
1.60 |
0.39 |
0.134 |
0.162 |
5.64 |
|
|
and |
83.22 |
86.32 |
3.10 |
1.82 |
0.27 |
0.187 |
0.118 |
3.83 |
|
|
and |
130.45 |
150.40 |
19.95 |
0.32 |
0.02 |
0.040 |
0.002 |
0.21 |
|
|
Including |
132.02 |
138.15 |
6.13 |
0.69 |
0.03 |
0.087 |
0.003 |
0.26 |
|
|
Including |
132.02 |
133.50 |
1.48 |
1.87 |
0.06 |
0.240 |
0.007 |
0.30 |
|
|
and |
206.64 |
260.00 |
53.36 |
0.31 |
0.12 |
0.017 |
0.044 |
1.17 |
|
|
Including |
226.46 |
238.65 |
12.19 |
0.51 |
0.24 |
0.025 |
0.066 |
1.83 |
|
|
IS06-14 |
37.18 |
498.93 |
461.75 |
0.11 |
0.04 |
0.006 |
0.014 |
0.59 |
|
|
Including |
37.18 |
67.66 |
30.48 |
0.27 |
0.06 |
0.026 |
0.011 |
0.64 |
|
|
and |
189.58 |
241.39 |
51.81 |
0.26 |
0.01 |
0.010 |
0.019 |
1.27 |
|
|
IS06-16 |
3.30 |
394.70 |
391.40 |
0.15 |
0.09 |
0.005 |
0.018 |
0.77 |
|
|
Including |
17.37 |
52.42 |
35.05 |
0.20 |
0.15 |
0.001 |
0.024 |
1.34 |
|
|
and |
201.85 |
236.60 |
34.75 |
0.20 |
0.09 |
0.010 |
0.018 |
0.97 |
|
|
and |
278.46 |
393.79 |
115.33 |
0.29 |
0.15 |
0.012 |
0.034 |
1.13 |
|
|
Including |
278.46 |
282.54 |
4.08 |
0.96 |
0.59 |
0.010 |
0.278 |
4.40 |
|
|
Including |
278.46 |
279.49 |
1.03 |
2.85 |
1.60 |
0.032 |
0.985 |
9.57 |
|
|
and |
341.97 |
354.16 |
12.19 |
1.08 |
0.56 |
0.057 |
0.063 |
3.29 |
|
|
Including |
346.54 |
351.11 |
4.57 |
2.60 |
1.33 |
0.140 |
0.149 |
7.00 |
|
|
IS08-18 |
7.43 |
186.60 |
179.17 |
0.38 |
0.21 |
0.016 |
0.038 |
1.39 |
|
|
Including |
46.18 |
117.66 |
71.48 |
0.80 |
0.45 |
0.035 |
0.073 |
2.46 |
|
|
Including |
50.76 |
70.62 |
19.86 |
2.02 |
1.14 |
0.090 |
0.156 |
5.37 |
|
|
Including |
58.51 |
67.12 |
8.61 |
4.15 |
2.32 |
0.190 |
0.314 |
10.82 |
|
|
Including |
63.34 |
67.12 |
3.78 |
6.00 |
2.63 |
0.400 |
0.298 |
8.96 |
|
|
and |
97.64 |
108.50 |
10.86 |
0.94 |
0.46 |
0.047 |
0.107 |
2.60 |
|
|
Including |
104.23 |
108.50 |
4.27 |
1.44 |
0.55 |
0.090 |
0.210 |
2.42 |
|
|
IS08-26 |
2.45 |
273.70 |
271.25 |
0.23 |
0.09 |
0.015 |
0.023 |
0.77 |
|
|
Including |
44.05 |
92.30 |
48.25 |
0.51 |
0.14 |
0.044 |
0.030 |
0.63 |
|
|
Including |
81.24 |
90.80 |
9.56 |
2.18 |
0.50 |
0.206 |
0.120 |
2.39 |
|
|
Including |
81.24 |
85.45 |
4.21 |
4.76 |
1.00 |
0.466 |
0.244 |
4.35 |
|
|
and |
152.48 |
197.50 |
45.02 |
0.40 |
0.18 |
0.022 |
0.051 |
1.73 |
|
|
Including |
171.68 |
180.76 |
9.08 |
0.61 |
0.26 |
0.032 |
0.087 |
2.63 |
|
|
IS08-36 |
3.12 |
288.30 |
285.18 |
0.22 |
0.06 |
0.018 |
0.016 |
0.61 |
|
|
Including |
14.48 |
196.50 |
182.02 |
0.31 |
0.08 |
0.028 |
0.019 |
0.70 |
|
|
Including |
28.72 |
36.58 |
7.86 |
0.70 |
0.16 |
0.066 |
0.028 |
1.58 |
|
|
and |
59.01 |
64.04 |
5.03 |
4.72 |
0.54 |
0.510 |
0.306 |
6.65 |
|
|
and |
78.85 |
90.32 |
11.47 |
0.48 |
0.13 |
0.042 |
0.019 |
1.24 |
|
|
and |
132.12 |
144.92 |
12.80 |
0.44 |
0.17 |
0.032 |
0.012 |
0.68 |
|
|
IS08-38 |
4.57 |
157.56 |
152.99 |
0.45 |
0.16 |
0.033 |
0.024 |
1.05 |
|
|
Including |
24.14 |
86.23 |
62.09 |
1.02 |
0.37 |
0.078 |
0.046 |
2.18 |
|
|
Including |
52.83 |
77.99 |
25.16 |
2.08 |
0.67 |
0.175 |
0.064 |
3.34 |
|
|
Including |
61.73 |
68.42 |
6.69 |
4.21 |
1.22 |
0.379 |
0.088 |
5.74 |
|
|
Including |
66.27 |
68.42 |
2.15 |
9.22 |
2.33 |
0.885 |
0.133 |
12.09 |
|
|
IS08-39 |
2.65 |
305.70 |
303.05 |
0.29 |
0.11 |
0.021 |
0.019 |
0.76 |
|
|
Including |
31.58 |
96.50 |
64.92 |
0.52 |
0.29 |
0.020 |
0.061 |
1.92 |
|
|
Including |
31.58 |
43.59 |
12.01 |
1.01 |
0.69 |
0.016 |
0.171 |
3.91 |
|
|
and |
75.83 |
91.58 |
15.75 |
0.99 |
0.42 |
0.061 |
0.091 |
3.13 |
|
|
Including |
81.68 |
88.87 |
7.19 |
1.51 |
0.67 |
0.096 |
0.071 |
4.51 |
|
|
and |
159.04 |
226.86 |
67.82 |
0.51 |
0.08 |
0.054 |
0.014 |
0.58 |
|
|
Including |
160.54 |
188.06 |
27.52 |
1.01 |
0.15 |
0.110 |
0.028 |
1.19 |
|
|
Including |
163.60 |
173.74 |
10.14 |
2.50 |
0.31 |
0.280 |
0.065 |
2.77 |
|
|
Including |
163.60 |
166.95 |
3.35 |
4.10 |
0.70 |
0.424 |
0.159 |
6.64 |
|
|
IS08-44 |
3.05 |
350.67 |
347.62 |
0.22 |
0.06 |
0.018 |
0.016 |
0.62 |
|
|
Including |
35.22 |
49.15 |
13.93 |
0.34 |
0.23 |
0.004 |
0.057 |
2.51 |
|
|
and |
80.17 |
102.04 |
21.87 |
0.31 |
0.16 |
0.011 |
0.070 |
1.00 |
|
|
Including |
80.17 |
83.15 |
2.98 |
1.09 |
0.60 |
0.005 |
0.455 |
2.96 |
|
|
and |
133.79 |
147.39 |
13.60 |
0.52 |
0.11 |
0.051 |
0.017 |
1.23 |
|
|
Including |
133.79 |
136.75 |
2.96 |
1.43 |
0.15 |
0.166 |
0.022 |
1.60 |
|
|
and |
200.90 |
271.55 |
70.65 |
0.55 |
0.03 |
0.067 |
0.012 |
0.48 |
|
|
Including |
235.58 |
240.15 |
4.57 |
0.92 |
0.01 |
0.120 |
0.005 |
0.27 |
|
|
and |
256.69 |
271.55 |
14.86 |
1.47 |
0.02 |
0.193 |
0.004 |
0.23 |
|
|
Including |
259.69 |
262.76 |
3.07 |
5.97 |
0.00 |
0.795 |
0.001 |
0.00 |
|
|
IS08-45 |
2.86 |
375.27 |
372.41 |
0.23 |
0.09 |
0.015 |
0.021 |
0.84 |
|
|
Including |
49.32 |
170.64 |
121.32 |
0.35 |
0.18 |
0.016 |
0.033 |
1.82 |
|
|
Including |
55.76 |
71.83 |
16.07 |
0.61 |
0.31 |
0.025 |
0.081 |
3.26 |
|
|
and |
86.54 |
111.26 |
24.72 |
0.52 |
0.28 |
0.020 |
0.062 |
3.25 |
|
|
Including |
122.53 |
130.59 |
8.06 |
0.65 |
0.24 |
0.042 |
0.063 |
3.41 |
|
|
and |
242.16 |
255.07 |
12.91 |
2.17 |
0.21 |
0.231 |
0.212 |
2.66 |
|
|
Including |
242.16 |
246.99 |
4.83 |
5.48 |
0.42 |
0.599 |
0.548 |
5.84 |
|
|
Including |
245.40 |
246.99 |
1.59 |
12.12 |
0.44 |
1.536 |
0.104 |
5.90 |
|
|
IS08-47 |
5.18 |
373.08 |
367.90 |
0.17 |
0.09 |
0.007 |
0.019 |
0.71 |
|
|
Including |
70.70 |
216.94 |
146.24 |
0.30 |
0.15 |
0.014 |
0.039 |
1.24 |
|
|
Including |
95.92 |
108.30 |
12.38 |
0.51 |
0.33 |
0.017 |
0.044 |
2.03 |
|
|
and |
151.88 |
163.98 |
12.10 |
1.04 |
0.43 |
0.045 |
0.244 |
4.07 |
|
|
Including |
151.88 |
156.74 |
4.86 |
2.07 |
0.87 |
0.083 |
0.558 |
6.76 |
|
|
Including |
151.88 |
153.35 |
1.47 |
3.57 |
1.68 |
0.209 |
0.273 |
7.28 |
|
|
and |
298.93 |
326.87 |
27.94 |
0.31 |
0.19 |
0.012 |
0.019 |
0.89 |
|
|
Including |
306.32 |
309.25 |
2.93 |
1.23 |
1.07 |
0.001 |
0.110 |
5.11 |
|
|
and |
318.44 |
321.51 |
3.07 |
0.87 |
0.23 |
0.081 |
0.024 |
1.20 |
|
|
IS08-50 |
3.46 |
395.60 |
392.14 |
0.21 |
0.10 |
0.012 |
0.019 |
0.82 |
|
|
Including |
16.96 |
228.10 |
211.14 |
0.33 |
0.15 |
0.019 |
0.030 |
1.34 |
|
|
Including |
66.95 |
91.02 |
24.07 |
0.93 |
0.37 |
0.063 |
0.058 |
3.34 |
|
|
Including |
69.95 |
75.95 |
6.00 |
1.65 |
0.30 |
0.166 |
0.063 |
3.73 |
|
|
Including |
72.95 |
75.95 |
3.00 |
2.37 |
0.28 |
0.259 |
0.096 |
4.85 |
|
|
and |
215.44 |
217.60 |
2.16 |
3.63 |
0.72 |
0.362 |
0.128 |
6.40 |
|
*Note: CuEq% calculation using Cu@$4/lb, Mo@$30/lb, Au@$2500/oz and Ag@$30/oz. A full table of results can be found on the Company’s website project page https://www.cascadecopper.com/copper-plateau-project/
Target Generation
The compilation and modelling of the Copper Plateau data has revealed a strong correlation between the magnetics, induced polarization, surface soil samples, and high copper-molybdenum values in historic drilling. It also shows that the historic drilling indicates a high grade trend that continues at depth to the south east as well as a strong indication of continuation towards the south.
The strong positive correlation can now be used to plan additional work. For instance, a wide-spaced, deep penetrating Induced Polarization survey is proposed covering the entire 3.5km by 5.5km corridor of expansive copper and molybdenum in soil anomalies that coincide with magnetic inversion isoshells. This survey will cover the main mineralized zone to test for depth extension as well as the highly anomalous target zones to the south, northwest, and west of the main zone where similar correlations occur. The high copper and molybdenum in soils hints at a nearby bedrock source, while the associated cupolas of high magnetic intensity could indicate high-temperature quartz-magnetite-bornite zones that released mineral rich hydrothermal fluids altering, de-magnetizing, and mineralizing the adjacent rocks. The planned IP survey across these prospective zones will identify the better mineralized areas currently under cover, creating the highest priority drill targets.
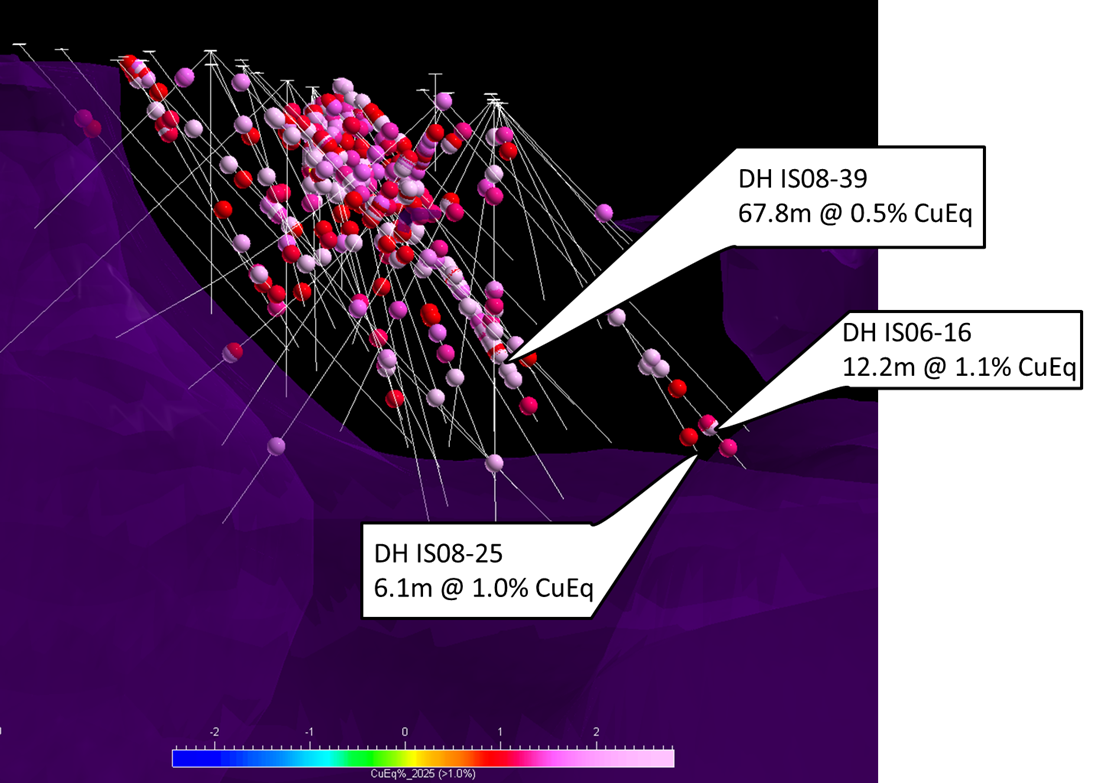
Click Image To View Full Size
Figure 3: Historic drill hole traces with >1% CuEq intersections showing impressive grades at depth . Looking North.
Next Steps
The Company plans to commission an IP survey to cover the S, W, and NW extension areas, where the soil sampling shows anomalous copper and molybdenum and the magnetic inversion modelling indicates a high flanked by low magnetic intensity. The company also plans several drill holes to test the down-plunge high grade potential as indicated by a number of historic holes that carried significant mineralization at depth.
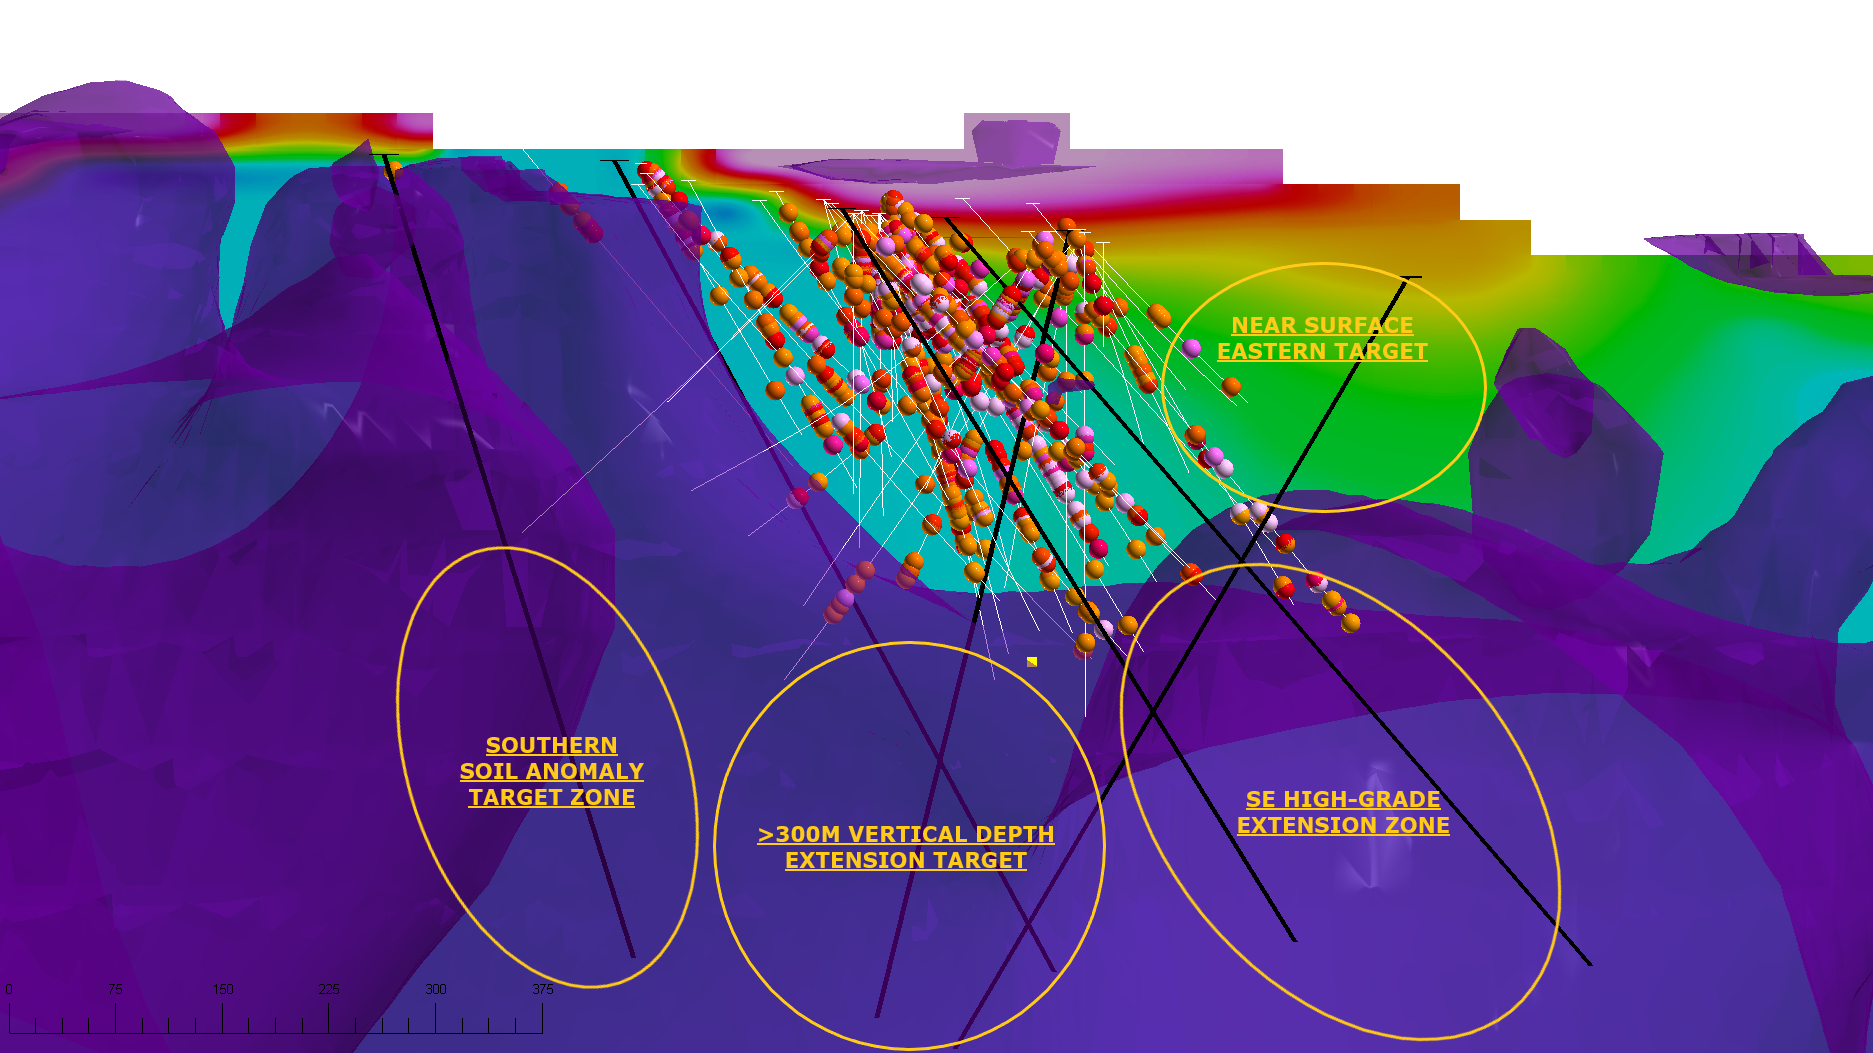
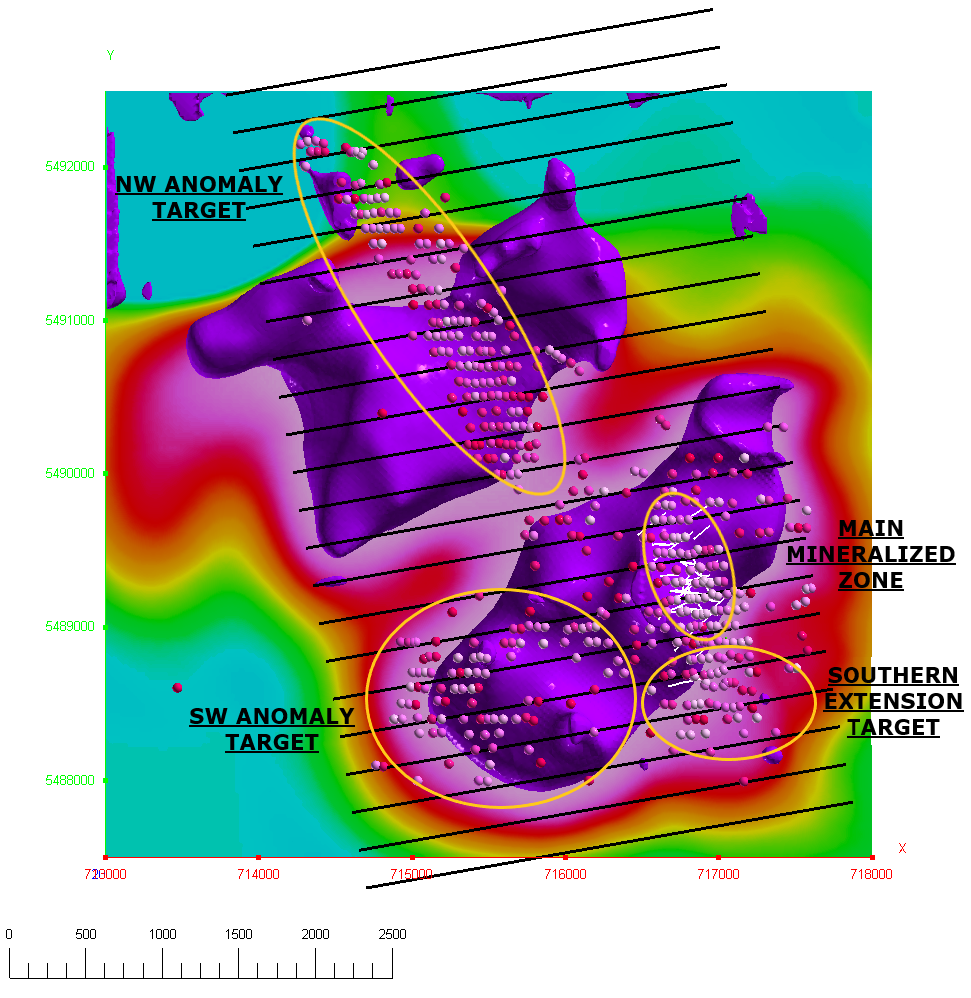
Click Image To View Full Size
Figure 4: Magnetic inversion model (magenta) with historic drilling (>0.5% CuEq), target zones surrounding the Main Mineralized Zone (yellow), and potential drill holes (black). Looking North.
Click Image To View Full Size
Figure 5: Plan view showing magnetic inversion model in magenta, drill traces at the Main Mineralized Zone (white), copper in soil (>150ppm) as spheres, proposed IP lines (black), and anomaly target zones (yellow)
Drill Sample Analysis QA/QC Protocol
The bulk of the drilling compiled by the QP for this release was conducted in 2008 with resampling and infill sampling completed in 2010 which followed a rigorous QA/QC protocol and is considered valid; however, complete geostatistical analysis of the QA/QC data has not been completed by the QP at this time and these results should be considered preliminary.
Blanks: A total of 82 external blanks were added into the sample chain of custody during the 2010 sampling program; all of which returned very low values of Cu and Mo. Therefore, blanks show no sign of cross-contamination in the analytic labs preparation / analysis.
Resplits: A total of 180 resplits were analyzed by ACME over the course of the 2010 sampling program. 27 out of 180 samples (15.0% of the population) varied more than +/- 20% from the original value for Copper. Regression analysis of the paired values shows that the majority of resplits that fail are below 500ppm Cu and only one fails above 1000ppm. For molybdenum, 54 out of 180 samples (30% of total population) were greater than +/- 20% from original value. Again, visual analysis of the paired values on a regression chart, shows that the majority of resplits that fail for Mo are below 100ppm with only one resplit failing above 500ppm.
Repeats: A total of 195 repeats for copper and 234 repeats for molybdenum were analyzed by ACME. Analysis of paired values by the resampling geotechnical company on an XY scatter chart revealed that: 1) 2 out of 195 (1.0%) repeats for copper failed and neither was above the 1000 ppm cutoff; and 2) 28 out of 234 (12.0%) repeats for moly failed, none of which were above 200ppm. Analysis of the repeat data shows that precision was well within acceptable ranges during the entire analytical process.
External Standards: External standards were introduced into the chain of custody and performance of the standards was analyzed by the resampling geotechnical company by producing Stoddart charts from the accepted value and standard deviation (SD) derived from round robin analysis. Any result within +/-2SD of the accepted value is considered a pass and any result between +/-2SD and +/-3SD is considered a warning. Data plotting greater than +/-3SD is a fail. A moving average of the dataset was utilized to monitor accuracy during the analytic program.
Copper: A total of 82 standards were analyzed for copper via ACME's 1DX package (AR / ICP-OES) with varying results across three different standards (Cu126, Cu134, and Cu170). Cu126 performed very well, Cu134 performed poorly, and Cu170 performed moderately well. An additional 63 standards across two different standards (Cu134 and Cu152) were analyzed for copper via ACME's 7TD package (Total Digestion / AAS). Overall results for the 7TD analytic technique were much better overall, likely due to the fact that 7TD package is considered an ore grade analysis rather than a geochemical grade analysis.
Molybdenum: A total of 147 external standards were analyzed for Molybdenum via ACMEs 1DX package (AR/ICP-OES) with varying results across four different standards (Cu126, Cu134, Cu152, and Cu170) with performance mimicking that of copper. An additional 21 standards across two different standards (Cu134 and Cu152) were analyzed for Molybdenum via ACME's 7TD technique. Overall, the 7TD package performed much better than the 1DX package with all but one sample passing and falling within the +/-2SD limit.
The Qualified Person responsible for the technical content of this press release is Shannon Baird, P.Geo, Vice President Exploration of Cascade Copper Corp.
1: Teck Resources AIF 2022
2: Copper Mountain NI43-101 Aug 1, 2022
3:Copper Deposits of the NW Cordilleran. CIM Spec. Vol 46
Cascade Copper will host a live interview to discuss this release on Thursday February 27 at 12:00 ET. Please click here to register for the event.
About Cascade Copper
The Corporation is an exploration stage natural resource company engaged in the evaluation, acquisition, and exploration of copper based mineral resource properties. Cascade is focused on copper and gold, porphyry and epithermal deposits in British Columbia. Cascade’s priority is to conduct exploration, including drilling on its flagship Rogers Creek Property located in the Coast Mountain Belt of British Columbia, 90 kilometres northeast of Vancouver, in the Southwest Mining Region. Cascade currently now has five projects, including the Centrefire Copper Project, the Copper Plateau Copper-Moly Project, Fire Mountain Copper-Gold Project, the Bendor Gold Project, and the flagship Rogers Creek Copper-Gold Project.
FOR FURTHER INFORMATION, PLEASE CONTACT:
CASCADE COPPER CORP.
Jeffrey S. Ackert, President and CEO
Vancouver, BC V6E 4A4
Telephone: 1 613 851 7699
E-Mail: info@cascadecopper.com
Neither the CSE nor its Regulation Services Provider (as that term is defined in the policies of the CSE) accepts responsibility for the adequacy or accuracy of this release.
DISCLAIMER & FORWARD-LOOKING STATEMENTS
This news release includes certain “forward-looking statements” which are not comprised of historical facts. Forward-looking statements are based on assumptions and address future events and conditions, and by their very nature involve inherent risks and uncertainties. Although these statements are based on currently available information, Cascade Copper Corp. provides no assurance that actual results will meet management’s expectations. Factors which cause results to differ materially are set out in the Company’s documents filed on SEDAR. Undue reliance should not be placed on “forward looking statements.”
Copyright (c) 2025 TheNewswire - All rights reserved.
