


NPV of $3.8 Billion with an After-tax IRR of 45% at spot prices
Highlights:
-
The 2025 PEA outlines robust economics, unlocking copper value through gold
- Base Case: After-tax net present value (“NPV”) of $2 billion (US$1.5 billion) at a 7% discount rate, after-tax internal rate of return (“IRR”) of 29%, 1.9-year payback period and 29-year life of mine (“LOM”)
- After-tax NPV of $3.8 billion (US$2.6 billion) at 7%, after-tax IRR of 45% and a 1.4-year payback at spot prices
- Phase 1 average annual production of 200,000 ozs Au and 48mm lbs Cu over 5 years, with 157 million lbs Cu Eq. or approx. 307,000 ozs Au Eq. LOM
- LOM revenue of 48% copper, 45% Au, and 7% Mo at Base Case prices, and 50% Au, 44% Cu and 6% Mo at spot
- Phase 1 operating cash flow of $2 billion at Base Case prices supports rapid payback of 1.9 years and fully funds Phase 2 expansion capex
- Among the lowest cost and capital intensity projects relative to peer group
- Two-phase approach at single plant site with Phase 1 at 40,000 tonnes per day (“tpd”), doubling to 80,000tpd
- NPV of $2.0 billion (US$1.5 billion) is 1.7 times initial capital investment of $1.1 billion (US$847 million) at Base Case pricing and 3.3 times initial capex at spot prices
- Phase 1 cash cost of US$763/oz Au Eq. or US$1.49/lb Cu Eq. sits in first quartile globally i
-
Long-term opportunity spanning 35-kilometer porphyry district
- 29-year mine plan includes only 753Mt of material of the 905Mt Indicated and 214Mt Inferred Resource
- New discovery at West Goodspeed, located within 1km of Red Dog, not included in current resource
- $7 million fully funded exploration program focused on expanding higher margin and grade northwest corridor
-
Furthers the Company’s sustainable development goals
- Reduced emissions from Phase 1 operations, increased electrification opportunities
- Estimated LOM carbon intensity among the lowest in Canada for open pit copper mines ii
Northisle Copper and Gold Inc. (TSX-V: NCX) (“Northisle” or the “Company”) is pleased to announce the positive results from a Preliminary Economic Assessment (the “2025 PEA”) for its 100% owned North Island Project (the “Project”) that demonstrate excellent economics from the staged development of the Project.
This press release features multimedia. View the full release here: https://www.businesswire.com/news/home/20250219753267/en/
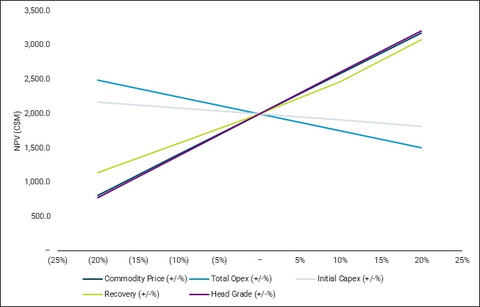
Figure 1: Sensitivity Summary Post-Tax NPV (7%) (Graphic: Business Wire)
The 2025 PEA is based on a two-phase development of the Company’s 100% owned Northwest Expo and Red Dog deposits, followed by the Hushamu deposit concurrent with a plant expansion. The 2025 PEA considers the processing of 753 million tonnes of mineable material within three open pit deposits over a 29-year mine life. During the first phase, throughput is approximately 40,000tpd resulting in an initial capital expenditure of approximately $1.1 billion (US$849 million). Production includes a combination of gold doré and gold-rich copper concentrate. The second phase contemplates twinning the mill for a total of 80,000tpd in year 6 to produce copper concentrate (containing significant payable gold), additional gold doré, and a molybdenum concentrate (containing payable rhenium). Phase 1 delivers a short payback period of 1.9 years and strong operating cash flows (net of sustaining capital) of approximately $400 million per year that provide a strong return and fully fund Phase 2 construction starting in year 5 (see Figure 4).
Dale Corman, Chairman, Cornerstone Shareholder, and Mining Hall of Fame recipient, commented: “I have always believed that the North Island Project is among the most promising copper and gold projects in BC, and now, I believe it’s among the most promising in the world. The results of the PEA highlight the Project’s economic potential and the opportunity across our 35km district. Our team continues to make disciplined discoveries which we expect will continue to add value for shareholders.”
Sam Lee, President and CEO of Northisle added, “The 2025 PEA confirms our view that the North Island Project has the potential to be among the best copper and gold projects in Canada. Our approach to optimizing the PEA was built upon two strategic pillars: lowering the project capital intensity through a phased approach while maximizing overall project value and returns. Upon achieving these goals, we now have a project that sharply distinguishes itself from other more capital-intensive copper projects by unlocking our copper value through gold.
Of equal importance, we have just scratched the surface across our 35-kilometer porphyry district. Through our fully funded 2025 exploration program focused on the Northwest Corridor, we will test for the causative intrusion at Northwest Expo, seek to expand the footprint of West Goodspeed both along strike and via fault offsets, and in-fill West Goodspeed to enhance continuity. In our view, the combination of exploration potential and a robust development project at its core make the North Island Project one of Canada’s most compelling copper AND gold projects.
With continued support of our First Nations partners, the BC and Federal Government, our shareholders and other stakeholders, we look forward to our project providing meaningful benefits in the years and decades to come.”
Jagrup Brar, Minister of Mining and Critical Minerals stated “Responsible resource development of critical minerals in partnership with First Nations is proven to expedite mining projects in B.C. That’s why we are pleased to see Northisle continue to progress its North Island Project to unlock copper, one of Canada’s critical minerals. We look forward to working with Northisle on obtaining efficient permitting decisions.”
The Company will host a conference call and webcast on February 19, 2025 at 11:00 AM Eastern time (8:00 AM Pacific time). Details to access the call can be found below.
Key performance indicators are summarized in Table 1 below.
Table 1: 2025 Base Case Summary Project Metrics
|
Project Stage |
Production |
AISC |
After-tax Avg. Free Cash Flow |
After-tax NPV (7%) |
After-tax IRR |
GHG Emissions (kg CO 2 /lb . ) |
|||||||
|
Cu
|
Au
|
Cu Eq.
|
Au Eq. (Koz) |
Cu by-product (US$/lb) |
Au by-product (US$/oz) |
Cu Eq. (US$/lb) |
Au Eq. (US$/oz) |
$ mm |
$ mm |
% |
Cu |
Cu Eq. |
|
|
Phase 1 (first 5 years) average |
48 |
200 |
151 |
294 |
$(3.23) |
$370 |
$1.83 |
$938 |
357 |
1,996 |
28.6 |
1.17 |
0.56 |
|
Life of mine (“LOM”) average |
75 |
137 |
157 |
307 |
$0.47 |
$93 |
$2.41 |
$1,232 |
199 |
||||
|
Note: Cu Eq. based on Base Case metal prices and includes molybdenum and gold. See Table 2 for details. |
|||||||||||||
2025 PEA Summary
The 2025 PEA was prepared in accordance with National Instrument 43-101 Standards of Disclosure for Mineral Projects (“NI43-101”) by Ausenco Engineering Canada ULC (“Ausenco”) in conjunction with an updated mine plan prepared by Moose Mountain Technical Services (“Moose Mountain”) and incorporates the previously announced integrated resource estimate for the North Island Project prepared by Moose Mountain (the “2024 Resource Estimate”). The 2025 PEA also includes an updated Mine Waste Storage Facility (“MWSF”) design prepared by Ausenco and updated metallurgical test work, also overseen by Ausenco. The Company plans to file the complete 2025 PEA report on SEDAR+ at www.sedarplus.ca within 45 days of this press release.
Table 2 summarizes the key findings of the 2025 PEA.
Table 2: 2025 PEA Economic Highlights
|
Base Case Economics |
Units |
Base Case |
|
|
Net Present Value (after tax NPV 7%) |
$ millions |
1,996 |
|
|
Net Present Value (after tax NPV 7%) |
US$ millions |
1,477 |
|
|
Internal Rate of Return |
% |
28.6 |
|
|
Payback |
Years |
1.9 |
|
|
Phase 1 Initial Capital Cost |
$ millions |
1,144 (US$847) |
|
|
Phase 2 Expansion Capital |
$ millions |
693 (US$513) |
|
|
Sustaining Capital Cost |
$ millions |
1,278 (US$946) |
|
|
Economic Assumptions |
Units |
Base Case |
|
|
Copper |
US$/lb |
4.20 |
|
|
Gold |
US$/oz |
2,150 |
|
|
Molybdenum |
US$/lb |
21 |
|
|
Rhenium |
US$/kg |
1,950 |
|
|
CAD:USD Exchange Rate |
US$/C$ |
0.74 |
|
|
Base Case Annual Financial Metrics |
Units |
First 5 years |
LOM |
|
Average Annual Revenue |
$ millions |
855 |
902 |
|
Average Annual On-site Operating Costs |
$ millions |
279 |
411 |
|
Avg. Ann. Operating Cash Flow (after tax) |
$ millions |
418 |
290 |
|
Avg. Ann. Free Cash Flow (after tax) |
$ millions |
357 |
199 |
The 2025 PEA is preliminary in nature and includes inferred mineral resources that are considered too speculative geologically to have the economic considerations applied to them that would enable them to be categorized as mineral reserves. There is no certainty that the projections described in the 2025 PEA will be realized. Mineral resources that are not mineral reserves do not have demonstrated economic viability.
Table 3 provides a summary of the key operating metrics from the 2025 PEA.
Table 3: 2025 PEA Operating Highlights
|
Operating Statistics |
Units |
Phase 1 (First 5 Years) |
Phase 2 |
Avg. LOM |
|
Mine Life |
Years |
5 |
23.7 |
28.7 |
|
Annual Throughput |
M tonnes |
14.8 |
28.6 |
26.2 |
|
Waste to Processed Material |
Waste:Processed Material |
1.43 |
0.74 |
0.81 |
|
Total Copper Recoveries |
% |
86.7 |
79.3 |
80.1 |
|
Total Gold Recoveries |
% |
83.1 |
57.4 |
62.3 |
|
Total Molybdenum Recoveries |
% |
NA |
51.4 |
51.4 |
|
|
|
|
|
|
|
Average Annual Payable Production |
||||
|
Copper |
mm lbs |
48 |
81 |
75 |
|
Gold |
Koz |
200 |
123 |
137 |
|
Molybdenum |
Klbs |
NA |
2,763 |
2,282 |
|
Cu Eq. |
mm lbs |
NA |
158 |
157 |
|
Au Eq. |
Koz |
294 |
309 |
307 |
|
C1 Cost – Cu Eq payable |
$/lb |
1.49 |
2.15 |
2.04 |
|
C1 Cost – Au Eq payable |
$/oz |
762 |
1,100 |
1,044 |
|
AISC – Cu Eq payable |
$/lb |
1.83 |
2.52 |
2.41 |
|
AISC – Au Eq payable |
$/oz |
938 |
1,291 |
1,232 |
|
CuEq = copper payable lbs + ((gold payable oz * gold price)/copper price) + ((molybdenum payable lbs *molybdenum price)/copper price)
|
||||
Economic Sensitivity
An economic analysis was conducted based on spot metal prices (the “Spot Price”) as of February 11, 2025 and assumed no changes to any other modifying factors.
Table 4: 2025 PEA Economic Highlights
|
Spot Price Economics |
Units |
Spot Price 1 |
|
Net Present Value (after tax NPV 7%) |
$ millions |
3,754 |
|
Net Present Value (after tax NPV 7%) |
US$ millions |
2,625 |
|
Internal Rate of Return |
% |
45.1 |
|
Payback |
Years |
1.4 |
|
Phase 1 Initial Capital Cost |
$ millions |
1,144 (US$847) |
|
Phase 2 Expansion Capital |
$ millions |
693 (US$513) |
|
Sustaining Capital Cost |
$ millions |
1,278 (US$946) |
|
Economic Assumptions |
Units |
Spot Price 1 |
|
Copper |
US$/lb |
4.67 |
|
Gold |
US$/oz |
2,908 |
|
Molybdenum |
US$/lb |
21 |
|
Rhenium |
US$/kg |
2,417 |
|
CAD:USD Exchange Rate |
US$/C$ |
0.70 |
|
1 – Spot price as of February 11 th , 2025 |
||
Table 5 summarizes the after-tax sensitivities of NPV and IRR to metal prices.
Table 5: 2025 PEA Post Tax Sensitivity Summary
|
Post-Tax Sensitivity to Metal Price (C$M)
|
|||||||||||||||
|
Post-Tax NPV Sensitivity To Discount Rate ($M) |
Post-Tax IRR Sensitivity To Discount Rate |
||||||||||||||
|
|
|
Commodity Price |
Spot Price |
|
|
Commodity Price |
Spot Price |
||||||||
|
Discount Rate |
$1,974 |
(20%) |
(10%) |
– |
10% |
20% |
– |
Discount Rate |
$0 |
(20%) |
(10%) |
– |
10% |
20% |
– |
|
3% |
1,649 |
2,598 |
3,546 |
4,500 |
5,450 |
6,299 |
3.00% |
16.6% |
22.9% |
28.6% |
33.7% |
38.6% |
45.1% |
||
|
5% |
1,160 |
1,903 |
2,642 |
3,384 |
4,121 |
4,814 |
5.00% |
16.6% |
22.9% |
28.6% |
33.7% |
38.6% |
45.1% |
||
|
7% |
806 |
1,404 |
1,996 |
2,588 |
3,176 |
3,754 |
7.00% |
16.6% |
22.9% |
28.6% |
33.7% |
38.6% |
45.1% |
||
|
8% |
665 |
1,207 |
1,742 |
2,276 |
2,805 |
3,337 |
8.00% |
16.6% |
22.9% |
28.6% |
33.7% |
38.6% |
45.1% |
||
|
10% |
439 |
890 |
1,334 |
1,774 |
2,210 |
2,667 |
10.00% |
16.6% |
22.9% |
28.6% |
33.7% |
38.6% |
45.1% |
||
|
Post-Tax NPV Sensitivity To OPEX ($M) |
Post-Tax IRR Sensitivity To OPEX |
||||||||||||||
|
|
|
Commodity Price |
Spot Price |
|
|
Commodity Price |
Spot Price |
||||||||
|
OPEX |
$1,974 |
(20%) |
(10%) |
– |
10% |
20% |
– |
OPEX |
$0 |
(20%) |
(10%) |
– |
10% |
20% |
– |
|
(20%) |
1,310 |
1,902 |
2,492 |
3,082 |
3,668 |
4,247 |
(20%) |
21.2% |
26.9% |
32.2% |
37.1% |
41.8% |
48.0% |
||
|
(10%) |
1,059 |
1,654 |
2,244 |
2,835 |
3,423 |
4,001 |
(10%) |
19.0% |
24.9% |
30.4% |
35.4% |
40.2% |
46.5% |
||
|
– |
806 |
1,404 |
1,996 |
2,588 |
3,176 |
3,754 |
– |
16.6% |
22.9% |
28.6% |
33.7% |
38.6% |
45.1% |
||
|
10% |
552 |
1,154 |
1,748 |
2,341 |
2,933 |
3,508 |
10% |
14.0% |
20.6% |
26.6% |
32.0% |
37.0% |
43.6% |
||
|
20% |
294 |
904 |
1,501 |
2,094 |
2,686 |
3,262 |
20% |
11.0% |
18.3% |
24.6% |
30.2% |
35.3% |
42.0% |
||
|
Post-Tax NPV Sensitivity To Initial Capex ($M) |
Post-Tax IRR Sensitivity To Initial Capex |
||||||||||||||
|
|
|
Commodity Price |
Spot Price |
|
|
Commodity Price |
Spot Price |
||||||||
|
Initial Capex |
$1,974 |
(20%) |
(10%) |
– |
10% |
20% |
– |
Initial Capex |
$0 |
(20%) |
(10%) |
– |
10% |
20% |
– |
|
(20%) |
988 |
1,581 |
2,173 |
2,760 |
3,350 |
3,929 |
(20%) |
21.9% |
29.5% |
36.3% |
42.5% |
48.2% |
56.0% |
||
|
(10%) |
898 |
1,492 |
2,085 |
2,673 |
3,263 |
3,841 |
(10%) |
18.9% |
25.8% |
32.0% |
37.6% |
42.9% |
50.0% |
||
|
– |
806 |
1,404 |
1,996 |
2,588 |
3,176 |
3,754 |
– |
16.6% |
22.9% |
28.6% |
33.7% |
38.6% |
45.1% |
||
|
10% |
715 |
1,314 |
1,910 |
2,500 |
3,092 |
3,667 |
10% |
14.7% |
20.4% |
25.7% |
30.5% |
35.1% |
41.0% |
||
|
20% |
622 |
1,224 |
1,820 |
2,412 |
3,004 |
3,580 |
20% |
13.2% |
18.4% |
23.4% |
27.9% |
32.1% |
37.6% |
||
|
Post-Tax NPV Sensitivity To Recovery Mill ($M) |
Post-Tax IRR Sensitivity To Recovery Mill |
||||||||||||||
|
|
|
Commodity Price |
Spot Price |
|
|
Commodity Price |
Spot Price |
||||||||
|
Recovery Mill |
$1,974 |
(20%) |
(10%) |
– |
10% |
20% |
– |
Recovery Mill |
$0 |
(20%) |
(10%) |
– |
10% |
20% |
– |
|
(20%) |
85 |
623 |
1,141 |
1,651 |
2,159 |
2,704 |
(20%) |
8.1% |
14.4% |
19.9% |
24.9% |
29.6% |
35.5% |
||
|
(10%) |
446 |
1,011 |
1,564 |
2,114 |
2,664 |
3,223 |
(10%) |
12.5% |
18.7% |
24.3% |
29.5% |
34.2% |
40.4% |
||
|
– |
806 |
1,404 |
1,996 |
2,588 |
3,176 |
3,754 |
– |
16.6% |
22.9% |
28.6% |
33.7% |
38.6% |
45.1% |
||
|
10% |
1,204 |
1,839 |
2,473 |
3,103 |
3,733 |
4,332 |
10% |
20.6% |
26.9% |
32.6% |
37.9% |
43.0% |
49.6% |
||
|
20% |
1,732 |
2,407 |
3,082 |
3,751 |
4,425 |
5,043 |
20% |
24.8% |
31.0% |
36.7% |
42.1% |
47.2% |
54.1% |
||
|
Post-Tax NPV Sensitivity To Head Grade ($M) |
Post-Tax IRR Sensitivity To Head Grade |
||||||||||||||
|
|
|
Commodity Price |
Spot Price |
|
|
Commodity Price |
Spot Price |
||||||||
|
Head Grade |
$1,974 |
(20%) |
(10%) |
– |
10% |
20% |
– |
Head Grade |
$0 |
(20%) |
(10%) |
– |
10% |
20% |
– |
|
(20%) |
(249) |
298 |
778 |
1,248 |
1,712 |
2,152 |
(20%) |
3.4% |
10.8% |
16.3% |
21.3% |
25.9% |
31.5% |
||
|
(10%) |
312 |
858 |
1,390 |
1,918 |
2,445 |
2,952 |
(10%) |
10.9% |
17.2% |
22.7% |
27.8% |
32.5% |
38.5% |
||
|
– |
806 |
1,404 |
1,996 |
2,588 |
3,176 |
3,754 |
– |
16.6% |
22.9% |
28.6% |
33.7% |
38.6% |
45.1% |
||
|
10% |
1,288 |
1,946 |
2,603 |
3,255 |
3,908 |
4,559 |
10% |
21.7% |
28.1% |
33.8% |
39.3% |
44.4% |
51.3% |
||
|
20% |
1,766 |
2,488 |
3,205 |
3,923 |
4,642 |
5,365 |
20% |
26.4% |
32.9% |
38.8% |
44.4% |
49.8% |
57.2% |
||
Note: FX sensitivity has only been applied to revenue in this study. Future studies will further model FX sensitivity. Spot Price is US$4.67/lb Cu, US$2,908/oz Au, US$21/lb Mo, US$2,417/kg Re and an FX rate of 0.70.
Comparison to 2021 PEA
Table 6: Comparison of 2021 PEA to 2025 PEA
|
Information/Data Type |
2021 PEA |
2025 PEA |
||||||||
|
Economics |
$1.1 billion After-tax NPV (8%) and 19% After-tax IRR |
$2.0 billion After-tax NPV (7%) and 29% After-tax IRR |
||||||||
|
Initial Capital Expenditure |
$1.4 billion |
$1.1 billion (US$847 million) |
||||||||
|
Payback of initial capital expenditure |
3.9 years |
1.9 years, expansion capital expenditure paid out of after-tax free cash flow |
||||||||
|
After-Tax Free Cash Flow |
Average annual after-tax free cash flow of $321 million during the first 6 years, $224 million LOM |
Average annual after-tax free cash flow (includes all capex) of $357m first 5 years, $199m LOM |
||||||||
|
AISC |
US$2.01/lb Cu Eq over first 6 years, US$2.14/lb Cu Eq LOM |
US$1.83/lb Cu Eq over first 5 years, US$2.41/lb Cu Eq LOM |
||||||||
|
Annual Production |
First 6-year average payable production of 112mm lbs Cu and 112 koz Au; LOM average payable production of 96mm lbs Cu and 100koz Au, including 1.0kt Mo |
First 5 year average payable production of 200koz Au and 48mm lbs Cu; LOM average annual payable production of 75mm lbs Cu and 137 koz Au, plus 1.0kt Mo and Re credits |
||||||||
|
Mine Life |
22 years |
29 years |
||||||||
|
Mine Capacity |
75 ktpd for Red Dog and Hushamu mine and mill |
2 Stage production plan, 40 ktpd expanding to 80 ktpd to provide early processing of Au rich NW Expo material to significantly improve project economics |
||||||||
|
Processing and Metallurgy |
Flotation of Red Dog and Hushamu material to produce Cu concentrate and Molybdenum concentrate |
Flotation plus cyanide leach of rougher and cleaner (Ph 1) and cleaner (Ph 2) flotation tails to add 15-25% improvement in Au recovery by producing Au doré |
||||||||
|
Project Capital Expenditure |
Single Phase initial capital - more difficult to finance |
2 Phase production provides significantly reduced initial capital to facilitate project financing. Second phase expansion paid entirely out of free cash flow. |
||||||||
|
|
|
|
|
|
|
|||||
|
Information/Data Type |
2021 PEA |
2025 PEA |
||||||||
|
Pricing |
|
Base Case |
Spot Price |
Base Discount to Spot |
Base Case |
Spot Price |
Base Discount to Spot |
|||
|
Cu Price |
US$/lb |
3.25 |
3.51 |
7% |
4.20 |
4.67 |
10% |
|||
|
Au Price |
US$/oz |
1,650 |
1,835 |
10% |
2,150 |
2,908 |
26% |
|||
|
Mo Price |
US$/lb |
10 |
10 |
0% |
21 |
21 |
0% |
|||
|
Re Price |
US$/kg |
1,256 |
1,256 |
0% |
1,950 |
2,417 |
19% |
|||
|
Exchange Rate |
USD/CAD |
0.75 |
0.75 |
0% |
0.74 |
0.70 |
(6%) |
|||
|
Production |
|
LOM |
First 5 years |
LOM |
||||||
|
Mine Life |
Years |
22 |
5 |
28.7 |
||||||
|
Total Mill Feed |
kt |
600,359 |
74,133 |
752,164 |
||||||
|
Strip Ratio |
Waste : Processed |
0.71 |
1.43 |
0.81 |
||||||
|
Mill Design Capacity |
tpd |
75,000 |
40,000 |
80,000 |
||||||
|
Processing and Metallurgy |
|
Cu and Au flotation to produce Cu con and separate Moly con |
Cu and Au flotation to produce Cu con and separate Moly con, cyanide leach of NW Expo and Red Dog ore rougher and cleaner tails, and Hushamu cleaner tails |
|||||||
|
Total Copper Recovery |
% |
86% |
86.7 |
80.1 |
||||||
|
Total Gold Recovery |
% |
47% |
83.1 |
62.3 |
||||||
|
Total Molybdenum Recovery |
% |
60% |
51.4 |
51.4 |
||||||
|
Average Annual Cu Production |
mm lbs |
96 |
48 |
75 |
||||||
|
Average Annual Au Production |
koz |
100 |
200 |
137 |
||||||
|
Average Annual Mo Production |
kt |
1.1 |
N/A |
1.0 |
||||||
|
Annual CuEq Production |
mm lbs |
156 |
151 |
157 |
||||||
|
Total Cu Recovered |
mm lbs |
2,035 |
240 |
2,168 |
||||||
|
Total Au Recovered |
koz |
2,143 |
1,002 |
3,932 |
||||||
|
Total Mo Recovered |
kt |
25 |
N/A |
30 |
||||||
|
Total CuEq Recovered |
mm lbs |
3,430 |
753 |
4,509 |
||||||
|
Operating Cost |
|
|
|
|
||||||
|
Mining Cost |
$/t mined |
2.32 |
3.16 |
3.12 |
||||||
|
Processing Cost |
$/t milled |
5.58 |
10.39 |
9.36 |
||||||
|
G&A Cost |
$/t milled |
0.38 |
1.25 |
0.68 |
||||||
|
Smelting and Refining Cost |
$/t milled |
1.32 |
1.65 |
0.81 |
||||||
|
Total Operating Cost |
$/t milled |
11.12 |
19.68 |
15.69 |
||||||
|
Cash Cost |
US$/lb CuEq |
2.09 |
1.49 |
2.04 |
||||||
|
AISC |
US$/lb CuEq |
2.14 |
1.83 |
2.41 |
||||||
|
Capital Costs |
|
|
|
|
||||||
|
Project Capital Expenditure |
$ millions |
1,442 |
1,144 |
1,837 |
||||||
|
Sustaining Capital |
$ millions |
197 |
325 |
1,278 |
||||||
|
Closure Cost |
$ millions |
71 |
N/A |
367 |
||||||
|
Salvage Cost |
$ millions |
25 |
N/A |
171 |
||||||
|
Financials |
|
|
|
|
||||||
|
Average Annual Operating Cash Flow After-tax |
$ millions |
n/a |
411 |
279 |
||||||
|
Average Annual Free Cash Flow After-tax |
$ millions |
224 |
357 |
199 |
||||||
|
NPV after-tax |
$ billions |
1.06 (8%) |
N/A |
2.00 (7%) |
||||||
|
IRR - after-tax |
% |
19 |
N/A |
28.6 |
||||||
|
Payback |
Years |
3.9 |
N/A |
1.9 |
||||||
Sustainability
Northisle has incorporated a focus on sustainability into its core strategy, emphasizing the monitoring, disclosure and improvement of ESG performance, recognizing it as equally important to the Company’s success as operating metrics. As a result, Northisle has summarized updated preliminary sustainability metrics for the North Island Project in Table 7 below.
Table 7: Preliminary Sustainability Metrics
|
Sustainability Statistics |
Units |
LOM Total / Avg. |
|
Direct job creation (permanent) |
FTE |
428 |
|
Site Energy Consumption |
||
|
Fuel (annual) |
000s liters |
35,470 |
|
Electricity (annual) |
MWh |
706,950 |
|
Energy Intensity |
kWh / lb CuEq |
4.55 |
|
Environmental |
||
|
Net water consumption |
liters / lb CuEq |
255 |
|
GHG Emissions – Scope 1 |
kg CO2e / lb CuEq |
0.56 |
|
Total Material to MWSF |
MT |
1,176 |
The above sustainability metrics were determined on a preliminary basis by referencing publicly available benchmarks for emissions related to key project energy sources as well as physical quantities estimated in the 2025 PEA. The selected metrics will evolve as the project is developed, to incorporate additional measures of ESG performance.
Permitting and Environment
The Project will likely require authorization under the Canadian Impact Assessment Act (IAA) and the British Columbia Environmental Assessment Act (EAA). There is currently a legal mechanism for cooperation between provincial and federal processes which allows projects to adopt coordination, substitution or joint panel review. The environmental assessment processes typically take three to five years. It should however be noted that the Impact Assessment Cooperation Agreement Between Canada and British Columbia is up for renewal in 2025.
Free, prior and informed consent, in line with the United Nations Declaration on the Rights of Indigenous Peoples (UNDRIP), is a foundation of the approach to environmental assessments (EA) in BC. Indigenous Nations play a critical role in scoping and reviewing projects that could impact their Rights or Indigenous Interests. The EAA requires consent from Indigenous groups that are identified as a “Participating Indigenous Nation”, and in some cases they may also be identified as an additional regulator. Indigenous Nations also have the option to undertake Indigenous-led assessments as Participating Indigenous Nations under 19(4) of the EAA. This may affect the EA process and timeline for the Project. Additional federal and provincial authorizations will likely be required for the Project and could take three years to obtain but would be pursued in parallel with the EA.
Preliminary baseline field surveys conducted for the Project include fisheries, hydrology, climate, and wildlife. Additional desktop studies have included these disciplines and hydrogeology. Additional baseline studies are planned for 2025.
Stakeholder Engagement
The Project is located within the separately claimed traditional territories of the Quatsino First Nation (the “Quatsino”), the Tlatlasikwala First Nation (the “Tlatlasikwala”), and the Kwakiutl First Nation (the “Kwakiutl”). Each respective First Nation is the best source for detailed information about its traditional territory. The Company has initiated discussions and maintains an ongoing dialogue with the Quatsino, the Tlatlasikwala and the Kwakiutl, as well as other First Nations and communities in proximity to the Project. The Company has and continues to actively employ members of local First Nations and other communities, and First Nations and local individuals and businesses.
In addition to consulting regularly with each First Nation, the Company has entered into consent-based exploration agreements and successive renewals with Quatsino and Tlatlasikwala in respect of exploration programs conducted within their territory. These agreements provide for an open, honest, transparent and fair process through which the Company can conduct certain activities to determine the viability of developing mines, mills, or related facilities for the commercial production of minerals in a manner which recognizes the rights of the respective First Nations.
The Company intends to continue to engage proactively with all potentially impacted parties.
Opportunities
The 2025 PEA demonstrates the potential for further development of the North Island Project and indicates several additional opportunities for further study which may contribute to further enhanced value, including:
- Optimization of the mineral process flowsheet: Once additional metallurgical testing is completed, the following can be confirmed: Optimum grind size selection and comminution selection, optimum regrind size for each deposit and regrind technology selection, optimization of leaching and absorption retention time and optimum source of leaching and cyanide detoxification oxygen.
- Additional step-out and in-fill drilling: There is potential for additional resources at West Goodspeed, located less than a kilometer from Red Dog, as well as potential extension of all the known deposits within the North Island Project, thus increasing the mineralized material available for development, including testing for the causative intrusion source for the higher-grade mineralization at Northwest Expo. In-fill drilling of the three currently defined deposits could further increase the indicated resource material. A fully funded exploration program is being advanced for 2025.
- Mining related test work: The current PEA applies assumptions based on existing test work which effect the pit design, and refinement of these may increase the indicated resource material. These include improved geotechnical and hydrogeological test work, geochemical test work, as well as market studies to outline potential capital for project financing.
- Reduce carbon emissions: High-level calculations at the time of this release indicate that converting the proposed diesel mine fleet to an electric fleet has the potential to result in avoidance of compliance payments for carbon emission exceedances and may result in payment for project credits. This depends on the strength of the BC OBPS market and may justify the cost of electrifying the fleet.
- Optimization of site infrastructure: Optimizing the plant location to reduce tailings pumping equipment and cost, utilising regenerative conveyors to add power to the overall system and reduce power consumption.
- Optimizing permitting schedule: There are opportunities to optimize the overall permitting schedule by advancing permitting while the EA process is underway. Although major permits cannot be issued for projects prior to the receipt of an Environmental Assessment Certificate, the EA and permitting processes can advance in parallel.
Next Steps
With the completion of the 2025 PEA, Northisle intends to continue to advance the North Island Project. Key next steps and milestones include:
- Northisle will continue to proactively engage with First Nations, local communities, government and key project stakeholders in support of the responsible development of the Project;
- Complete the drilling program including infill and step out drilling at Northwest Expo, infill drilling at Red Dog, and resource definition drilling and step out at West Goodspeed;
- Conduct plant site and MWSF site condemnation drilling;
- Initiate additional environmental baseline work;
- Conduct additional metallurgical test work to support the prefeasibility study;
- Conduct geotechnical investigations for open pit design, process plant mill foundation design, and MWSF dam design; and
- Commence a Prefeasibility Study.
A high-level project milestone schedule is provided in Figure 5.
2025 Exploration Overview
Northisle is currently in the final stages of planning its 2025 exploration program. The fully funded $7 million program will be focused on enhanced understanding of higher-grade, higher-margin potential in the vicinity of Northwest Expo and West Goodspeed, an area which is now being identified as the “Northwest Corridor”. To date, the discoveries in this area have improved overall project resource grade and margin and have generally been near surface, presenting a compelling option for further improving the North Island Project. The 2025 focus areas are highlighted in Figure 6, and the Company expects to announce further details on the program once available.
Webcast Details
The Company will host a conference call on February 19, 2025 at 11:00 AM Eastern time (8:00 AM Pacific time). Details to access the call live are as follows:
- Via telephone, by calling +1-844-763-8274 toll free in North America, and +1-647-484-8814 internationally
- Via webcast at: Webcast
The webcast will be archived for 6 months following the call at the above-noted link and on the Company’s website.
2025 PEA Details
The 2025 PEA is a comprehensive re-envisioning of the North Island Project built around several primary project goals, including:
- Consider staged development to reduce initial capital costs while maintaining optionality for a larger, long-lived operation
- Reconsider metallurgical approach to account for higher gold grades in the Northwest Expo and Red Dog pits
- When evaluating trade-offs, select the option with the highest overall return that addresses the capital criteria
- Minimize life-cycle impacts, specifically on a per unit produced basis
Changes to the Project design were extensive, including:
- The 2024 Resource Estimate, including the addition of the high-grade Northwest Expo deposit, as previously announced by the Company on October 10, 2024.
- Two phase development, including a 40,000tpd or 14.6 million t/a Phase 1 flowsheet with flotation followed by a leach of cleaner and rougher tails, plus an 80,000tpd or 29.2 million t/a Phase 2 flotation followed by a leach of cleaner tails flowsheet. The second phase of the development essentially twins the first phase process plant without the rougher tailings leach unit operation. The rougher tailings leach circuit will be repurposed to accommodate the additional cleaner tailings, and rougher tailings will no longer be leached. This results in significant savings in spares and maintenance costs, minimizes start up duration, and maximizes operations efficiencies.
- Updated metallurgical test work which resulted in significantly improved gold recoveries in Phase 1 based on the addition of leaching, and more conservative Phase 2 copper recovery estimates based on extensive flotation testing on additional samples over a range of primary grind sizes.
- Redesigned mine waste storage incorporating further developed waste characterization which increases overall mine waste capacity and reduces haul distance for non-acid-generating (NAG) waste rock.
- Relocated plant site and material transport layout to accommodate updated resources, to incorporate the addition of Northwest Expo, and to avoid active exploration targets.
- For Phase 1, specialized transport containers known as rotainers were selected to securely transport copper concentrate to the seaport of Nanaimo. The rotainers can be directly discharged into bulk carriers with existing container cranes. This eliminates the construction of a new concentrate loadout port which avoided significant initial capital cost. For Phase 2, concentrate loadout facilities are contemplated to be constructed at the former Island Copper port which is currently undergoing reclamation. Additional port sites have been evaluated as part of a preliminary port study, should the Island Copper port site not be available.
The 2025 PEA was produced independently by Ausenco and includes the 2024 Resource Estimate and a mine plan prepared by Moose Mountain. With improved economic results relative to the 2021 PEA, the Company can further accelerate development of the North Island Project while continuing its successful, targeted exploration program which has measurably added value by targeting near-surface resource additions within proximity to anticipate mine infrastructure with grades above the average resource grade.
Project Description
Location
The Project is located near the town of Port Hardy which is the main distribution centre for the north end of Vancouver Island. It has an airport with regular flights to Vancouver, a hospital, schools, and a college.
The North Island Project covers a west-northwest-trending ~40 x 8 km area north of the Holberg Inlet, approximately 25 km west of Port Hardy, on northern Vancouver Island, B.C. (Figure 7). The Property can be reached from Port Hardy by travelling via paved roads and then well-maintained logging roads. The Hushamu Deposit is accessed from Port Hardy by a paved road to Coal Harbour and then well-maintained logging roads that include the Coal Harbour Main Road, the Wanokana Road, and the Hushamu Main Road, which extends to the mouth of the Hushamu Valley. The Red Dog Deposit and Northwest Expo Deposit is accessible from Port Hardy by Holberg Road to a point about 45 km from Port Hardy where forestry access road NE 62 leads northward to the property.
Project Development Plan
The proposed North Island Project will comprise the construction, operation, and closure of a multiple open pit copper, gold, molybdenum and rhenium mine. The ore processing facilities will commence with a nominal milling rate of 40,000 t/d or 14.6 million t/a (“Phase 1”). The ore processing facilities will be expanded to achieve 80,000 t/d (29.2 million t/a) starting in the sixth year of operation (“Phase 2”). Recovery during Phase 1 will include a sequential flotation circuit to produce copper/gold concentrate, with rougher and cleaner tailings undergoing tank leaching to recover gold doré. In Phase 2, a second grinding and flotation line will be installed to increase processing capacity to 80 kt/d for processing the materials from the Hushamu deposit. The rougher tailings leach circuit will be repurposed to accommodate the additional cleaner tailings, and rougher tailings will no longer be leached. A molybdenum flotation circuit will be installed, allowing the plant to produce copper/gold concentrate and molybdenum concentrate containing rhenium.
The proposed mine plan involves conventional open pit mining and processing of 753 Mt of material, mining 561 Mt waste rock and 62 Mt overburden from three deposits. Phase 1 of the Project targets high-grade, near-surface resources from the Northwest Expo and Red Dog deposits for processing. Mining moves to the larger, lower grade, Hushamu deposit as the first two deposits are mined out and the Phase 2 mill expansion is implemented.
All Red Dog and Northwest waste materials will be placed near these deposits in waste rock storage facilities (WRSFs). Potentially acid generating material from these two deposits will be segregated and runoff captured. All potentially acid generating waste materials from Hushamu will be placed in the MWSF located east of the Hushamu open pit. Any waste materials from Hushamu that will not generate acid will be used to construct the MWSF embankments or stored northwest of the Hushamu pit. All tailings from all three open pits will be comingled with the acid generating waste rock from Hushamu in the MWSF. The MWSF has been designed to store 753 Mt of tailings and 423 Mt of potentially acid generating waste rock. The starter facility contains a small western embankment (15m high) and a larger eastern embankment (70m high) to contain the first two years of tailings. The MWSF will consist of multiple expansions and will use cyclone tailings to construct centerline raises with low permeability cores constructed of till to contain tailings and Hushamu potentially acid generating waste rock over the LOM. The raises will have an ultimate height of approximately 290 m. MWSF will have diversion channels to safely pass the design event non-contact water around the facility. The facility has been designed to provincial and national standards for a tailings storage facility.
At closure, all buildings will be removed, disturbed lands will be rehabilitated, the MWSF will be covered with a closure cover, and the property will be returned to otherwise functional use according to future approved reclamation plans and accepted practices at the time of closure.
Offsite infrastructure includes a new site access road to the process plant, a new 138 kV transmission line to be connected to the BC Hydro grid, and the development of a new bulk concentrate loadout terminal at the former Island Copper port during Phase 2.
Mineral Resources
The Mineral Resource Estimate (MRE) was updated in 2024 for the North Island Project, with an effective date of September 23, 2024. Resources are estimated for the Northwest Expo, Red Dog and Hushamu deposits. Notably, recent drilling at the West Goodspeed target has not yet been incorporated in the Resource Estimate or 2025 PEA. The Mineral Resource Estimate has a Base Case cutoff grade of $11.50 NSR to cover the preliminary estimate of processing and G&A costs. The combined MRE is summarized in Table 8.
Table 8: 2024 Resource Estimate
|
Class |
NSR Cutoff ($/ tonne) |
In Situ Tonnage and Grade |
Cu Metal (Mlbs) |
Au Metal (kOz) |
Mo Metal (Mlbs) |
Re Metal (klbs) |
CuEq Metal (Mlbs) |
NSR ($CDN/ tonne) |
|||||
|
Tonnage (ktonnes) |
Cu (%) |
Au (gpt) |
Mo* (ppm) |
Re* (ppm) |
CuEq (%) |
||||||||
|
Indicated |
10 |
968,402 |
0.15 |
0.23 |
75 |
0.43 |
0.31 |
3,183 |
7,163 |
160 |
908 |
6,520 |
24.53 |
|
11.5 |
905,922 |
0.16 |
0.24 |
75 |
0.42 |
0.32 |
3,107 |
6,939 |
149 |
847 |
6,330 |
25.48 |
|
|
15 |
736,243 |
0.17 |
0.26 |
73 |
0.42 |
0.35 |
2,830 |
6,215 |
119 |
676 |
5,692 |
28.29 |
|
|
20 |
508,221 |
0.20 |
0.31 |
71 |
0.40 |
0.41 |
2,279 |
5,018 |
79 |
445 |
4,579 |
33.18 |
|
|
25 |
336,105 |
0.23 |
0.36 |
67 |
0.37 |
0.47 |
1,719 |
3,894 |
49 |
273 |
3,511 |
38.73 |
|
|
30 |
221,789 |
0.26 |
0.42 |
63 |
0.34 |
0.54 |
1,259 |
2,985 |
31 |
166 |
2,652 |
44.59 |
|
|
35 |
148,701 |
0.28 |
0.48 |
57 |
0.31 |
0.61 |
911 |
2,310 |
19 |
102 |
2,009 |
50.63 |
|
|
Inferred |
10 |
233,749 |
0.12 |
0.21 |
53 |
0.31 |
0.27 |
602 |
1,581 |
27 |
161 |
1,381 |
21.59 |
|
11.5 |
213,878 |
0.12 |
0.22 |
52 |
0.31 |
0.28 |
571 |
1,525 |
24 |
147 |
1,320 |
22.58 |
|
|
15 |
156,463 |
0.13 |
0.26 |
52 |
0.31 |
0.32 |
455 |
1,310 |
18 |
109 |
1,104 |
25.96 |
|
|
20 |
78,849 |
0.14 |
0.36 |
46 |
0.29 |
0.42 |
252 |
920 |
8 |
51 |
727 |
34.43 |
|
|
25 |
41,109 |
0.14 |
0.51 |
25 |
0.16 |
0.54 |
128 |
675 |
2 |
14 |
493 |
45.72 |
|
|
30 |
27,885 |
0.13 |
0.63 |
10 |
0.07 |
0.65 |
82 |
562 |
1 |
4 |
397 |
54.63 |
|
|
35 |
21,542 |
0.13 |
0.72 |
2 |
0.01 |
0.73 |
63 |
496 |
0 |
0 |
345 |
61.16 |
|
|
*Mo and Re given value only at Hushamu |
|||||||||||||
|
Notes to Table 8:
|
The QP is of the opinion that issues relating to all relevant technical and economic factors likely to influence the prospect of economic extraction can be resolved with further work. These factors may include environmental permitting, infrastructure, sociopolitical, marketing, or other relevant factors. Additional disclosures relating to the Resource Estimate can be found in the Company’s press release “ Northisle Announces North Island Project Indicated Resource Estimate Increased to 3.1 billion lbs Cu and 6.9 million ozs Au ” dated October 10, 2024 and the NI43-101 Technical Report titled “ NI 43-101 Resource Estimate for the North Island Project – 2024 Update ” with an effective date of September 23, 2024.
Mining
Open pit mine designs, mine production schedules and mine capital and operating costs have been developed for the Northwest Expo, Red Dog, and Hushamu deposits at a scoping level of engineering. The mineral resources, including inferred class resources, form the basis of the mine planning.
The open pit activities are designed for approximately thirty years of operation. Mine planning is based on large scale conventional drill/blast/load/haul open pit mining methods suited for the Project location and local site requirements. The subset of mineral resources contained within the designed open pits are summarized in Table 9, with a $14/t NSR cut-off grade, and form the basis of the mine plan and production schedule, which is summarized in Figure 9. Estimated mine operating costs are summarized in Table 10.
Table 9: PEA Mine Plan Production Summary
|
Mine Plan Pit Contents |
Total |
NWE |
RD |
Hushamu |
|
PEA Mill Feed |
753 Mt |
46 Mt |
55 Mt |
652 Mt |
|
Mill Feed Net Smelter Return (NSR) Grade |
$28/t |
$58/t |
$39/t |
$25/t |
|
Copper Grade, Cu |
0.17% |
0.11% |
0.21% |
0.17% |
|
Gold Grade, Au |
0.27 g/t |
0.69 g/t |
0.30 g/t |
0.23 g/t |
|
Molybdenum Grade, Mo |
78 ppm |
- |
- |
90 ppm |
|
Rhenium Grade, Re |
0.45 ppm |
- |
- |
0.52 ppm |
|
Waste Overburden and Rock |
624 Mt |
97 Mt |
11 Mt |
516 Mt |
|
Waste : Processed Material Ratio |
0.8 |
2.1 |
0.2 |
0.8 |
Table 10: Estimated PEA Mine Operating Costs
|
Area |
Unit Cost
|
Y1 to Y5
|
Y6 to Y29
|
|
|
|
|
|
|
Drilling |
0.33 |
0.35 |
0.33 |
|
Blasting |
0.45 |
0.47 |
0.44 |
|
Loading |
0.34 |
0.30 |
0.34 |
|
Hauling |
1.19 |
1.02 |
1.22 |
|
Support |
0.45 |
0.48 |
0.45 |
|
Site Development |
0.03 |
0.07 |
0.02 |
|
Mine General |
0.33 |
0.44 |
0.32 |
|
Total Mine Operating Unit Cost |
3.12 |
3.14 |
3.12 |
Processing
The 2025 PEA contemplates a concentrator and related facilities processing mineralized material at a nominal rate of 40,000 t / d in Phase 1 and 80,000 t/d in Phase 2. The staged expansion approach has been selected due to the differing mineralization and grades present in the three primary deposits of NW Expo, Red Dog and Hushamu and in order to reduce initial capital costs and enhance overall returns. Phase 1 consists of 40 kt/d of mineralized material from NW Expo and Red Dog to be processed via flotation and leaching of both rougher and cleaner tailings to produce copper/gold concentrate and gold doré. In Phase 2, a second grinding and flotation line will be installed to increase processing capacity to 80 kt/d for processing the materials from the Hushamu deposit. The rougher tailings leach circuit will be repurposed to accommodate the additional cleaner tailings, and rougher tailings will no longer be leached. A molybdenum flotation circuit will be installed, allowing the plant to produce copper/gold concentrate and molybdenum concentrate containing rhenium.
Processing costs of the two phases are summarized in Table 11.
Table 11: Processing Costs
|
Area |
Y1 to Y5
|
Y6 to Y29
|
|
Power |
1.87 |
1.61 |
|
Reagents |
6.13 |
1.05 |
|
Consumables |
1.75 |
2.01 |
|
Maintenance |
0.40 |
0.32 |
|
Labour |
1.00 |
0.77 |
|
Mobile Equipment |
0.11 |
0.10 |
|
Lab Services |
0.05 |
0.05 |
|
Total Processing Cost |
11.32 |
5.93 |
Metallurgy
The process flowsheet has been designed based on historical test work completed on the Hushamu and Red Dog deposits and more recent test work conducted in 2022-2023 on samples representing the Northwest Expo deposit and additional areas of the Hushamu deposit.
Ausenco reviewed and interpreted several metallurgical test programs conducted under the direction of NorthIsle since 2009. The test programs utilized half drill core samples and were conducted at three metallurgical testing laboratories: ALS Metallurgy (Kamloops, BC), Base Metallurgical (Kamloops, BC) and SGS (Lakefield, ON). The bulk of the testing was conducted on composites of silica-clay-pyrite (SCP) and chlorite-magnetite (CMG) lithologies. Variability samples were tested to obtain increased comminution data on the Hushamu deposit as well as comminution and metallurgical performance across the NW Expo deposit. The test programs included mineralogical assessments, open circuit and locked cycle froth flotation testing, and cyanide leaching of flotation tailing streams.
Mineralogical assessments indicate that copper is primarily present in chalcopyrite, with minor levels of chalcocite/covellite. Sulphur content is mainly associated with pyrite. Gold is relatively fine grained and its association ranges between chalcopyrite, pyrite and non-sulphide gangue minerals.
Conventional processing techniques were evaluated which include grinding, froth flotation, and leaching process streams with cyanide solutions. The results suggest that the materials are amenable to processing by these conventional techniques and can produce copper concentrates that would be considered marketable. Results also indicate that between 32-65% of the gold in the feeds is recoverable to a copper flotation concentrate and the addition of cyanide leaching on the resulting flotation tails streams can provide an additional 15-32% gold recovery. The additional gold recovery would report to doré. Hushamu test results from the recent metallurgical test program (BL1141) and two earlier metallurgical programs (Base Met BL0059, ALS Metallurgy KM3409) indicated that the Hushamu bulk copper concentrate contained sufficient levels of molybdenum to be processed through a Cu-Mo separation circuit and recover a molybdenum concentrate. Molybdenum recovery to bulk Cu-Mo concentrates range from 50-55% with an estimated 90% recovery across a Cu-Mo separation circuit, as separation testing has not been tested. Red Dog and Northwest Expo materials have generally lower molybdenum contents and would not likely justify the operation of a Cu-Mo separation circuit.
Ausenco incorporated the results into the process plan, design criteria, flowsheet development and process equipment selection. Design mineral grades to the process plant are estimated at 0.24% copper, 0.30 g/t gold and 0.008% molybdenum with overall estimated recoveries of approximately 80% for copper, 62.3% for gold (concentrate and doré) and 51.4% for molybdenum.
Infrastructure
Project infrastructure for the North Island Project includes on-site infrastructure such as earthworks development, mine waste storage facility, site facilities and buildings, on-site roads, water management systems and site electrical power facilities. Off-site includes site access roads, fresh water supply, power supply, piping and port loadout facility.
The overall site layout was developed using the following criteria and factors:
- The facilities described above must be located on the North Island property to the greatest extent possible,
- The location of the waste rock storage facilities must be as close as possible to the open pit to reduce haulage distance,
- Locating the process plant at a central location to minimize conveyor movements,
- Balancing earthwork cuts and fills across process plant and pads,
- The location of the primary mineralized material and PAG waste crushing must be close to the North Island deposits to reduce haul distance,
- Arranging administration, offices and mine dry nearby one another to minimize waling distances (key during cold weather),
- Utilizing existing topography to minimize haulage uphill, and
- Minimizing footprint and environmental impacts to the extent practicable.
Operating Cost Summary
A preliminary operating cost estimate was prepared for the North Island Project for the two phases. Total site operating costs are summarized in Table 12.
Table 12: Total Site Operating Costs
|
Cost Area |
Life-of-Mine Cost ($M) |
LOM Unit Cost ($/t milled) |
Phase 1 Cost ($M) |
Phase 1 Unit Cost ($/t milled) |
Phase 2 Cost ($M) |
Phase 2 Unit Cost ($/t milled) |
|
Mining |
4,249 |
5.64 |
569 |
8.03 |
3,680 |
5.40 |
|
Process |
7,047 |
9.36 |
746 |
10.39 |
6,312 |
9.25 |
|
G&A |
514 |
0.68 |
89 |
1.25 |
426 |
0.62 |
|
Total |
11,810 |
15.69 |
1,393 |
19.67 |
10,417 |
15.27 |
|
Note: Totals may not sum due to rounding |
||||||
Capital Cost Summary
The capital cost estimate conforms to Class 5 guidelines of the Association for Advancement of Cost Engineering International for a PEA level study with an estimated accuracy of +50%/-30%. The capital costs are based on phased open pit mining operation, development of processing plant, onsite and offsite infrastructure, and tailings storage facilities plus the owner’s expenses and provisions.
The mine plan and associated mine initial and sustaining capital estimates have been prepared by Moose Mountain. Mine capital costs include provisions for site development and pre-stripping of the Northwest Expo and Red Dog deposits, open pit mine operations infrastructure, and the mine mobile fleet. The initial mine equipment mobile fleet is planned to be purchased either through financing or lease agreements with the vendors. Down payments and monthly lease payments are capitalized through the initial and sustaining periods of the Project. All expansion and replacement fleet purchases made after year 2 of the Project are planned as direct capital (non-lease) purchases.
The capital costs estimate was developed in Q3 2024 Canadian dollars based on Ausenco’s in-house database of projects and studies as well as experience from similar operations. The total costs of the initial and expansion phases and the sustaining capital costs are presented in Table 13 below.
Table 13: Capital Cost Summary
|
WBS |
WBS Description |
Initial Capital Cost -
|
Expansion Capital Cost -
|
LOM Sustaining
|
Total Capital Cost
|
|
1000 |
Mining |
144.3 |
0 |
698.0 |
842.3 |
|
2000 |
Process Plant |
449.8 |
359.3 |
0 |
809.1 |
|
3000 |
Tailing Facilities |
53.5 |
0 |
579.8 |
633.3 |
|
4000 |
On Site Infrastructure |
92.7 |
46.0 |
0 |
138.7 |
|
5000 |
Off Site Infrastructure |
73.0 |
62.4 |
0 |
135.4 |
|
|
Total Direct Costs |
813.3 |
467.7 |
1,277.8 |
2,558.8 |
|
6000 |
Indirects |
40.2 |
28.2 |
0 |
68.4 |
|
7000 |
EPCM Services |
93.7 |
65.1 |
0 |
158.8 |
|
|
Total Indirect Costs |
133.9 |
93.3 |
0 |
227.2 |
|
8000 |
Total Owner's Costs |
16.3 |
9.4 |
0 |
25.7 |
|
9000 |
Total Provisions |
180.2 |
123.4 |
0 |
303.6 |
|
|
Total Project Costs |
1,143.6 |
693.8 |
1,277.8 |
3,115.2 |
Economic Analysis
Economic evaluations were generated incorporating forecasts for economic inputs using the Base Case and Spot Price. The Spot Price case is based on prices as of February 11, 2025. See Table 14 for the results of the economic analysis.
Table 14: Base Case Economic Analysis
|
Item |
Units |
Phase 1 |
Phase 2 |
Total/Average |
||
|
Case |
Base |
|||||
|
General |
Copper Price |
US$/lb |
4.20 |
4.20 |
4.20 |
|
|
Gold Price |
US$/oz |
2,150 |
2,150 |
2,150 |
||
|
Molybdenum Price |
US$/lb |
21.00 |
21.00 |
21.00 |
||
|
FX rate |
CAD: USD |
0.74 |
0.74 |
0.74 |
||
|
Production |
Mine Life |
yrs |
5 |
23.7 |
28.7 |
|
|
Total Resource Mined |
kt |
74,134 |
678,030 |
752,164 |
||
|
LOM CuEq Grade |
% |
0.56% |
0.39% |
0.41% |
||
|
Total Waste Mined |
kt |
106,140 |
502,492 |
608,632 |
||
|
Strip Ratio |
w:o |
1.43:1 |
0.74:1 |
0.81:1 |
||
|
Average Annual Mined Resource |
ktpa |
14,827 |
28,582 |
26,187 |
||
|
Total Payable Copper |
Mlbs |
240 |
1,928 |
2,168 |
||
|
Total Payable CuEq |
Mlbs |
753 |
3,755 |
4,509 |
||
|
Average Annual Payable Copper |
Mlbs/yr |
48 |
81 |
75 |
||
|
Average Annual Payable CuEq |
Mlbs/yr |
151 |
158 |
157 |
||
|
Revenue/Costs |
Total Revenue |
$M |
4,276.0 |
21,642.9 |
25,918.9 |
|
|
Average Annual Revenue |
$M/yr |
855.2 |
912.3 |
902.4 |
||
|
EBITDA |
$M |
2,735.7 |
10,165.1 |
12,900.8 |
||
|
Average Annual EBITDA |
$M/yr |
547.1 |
428.5 |
449.2 |
||
|
Total On Site Operating Costs
|
$M |
1,393.0 |
10,417.5 |
11,810.4 |
||
|
Average Annual on Site Operating Cost |
$M/yr |
278.6 |
439.1 |
411.2 |
||
|
Mining Unit Cost |
$/t mined |
3.16 |
3.12 |
3.12 |
||
|
Mining Unit Cost |
$/t milled |
8.03 |
5.40 |
5.64 |
||
|
Process Unit Cost |
$/t milled |
10.39 |
9.25 |
9.36 |
||
|
G&A Unit Cost |
$/t milled |
1.25 |
0.62 |
0.68 |
||
|
Total Off Site Operating Costs
|
$M |
122.4 |
488.7 |
611.1 |
||
|
Cash Costs |
C1 Cost* |
US$/lb CuEq |
1.49 |
2.15 |
2.04 |
|
|
C3 Cost** |
US$/lb CuEq |
NA |
NA |
2.52 |
||
|
AISC |
US$/lb CuEq |
1.83 |
2.52 |
2.41 |
||
|
Capital Costs |
Initial Capex (Total) |
$M |
NA |
NA |
1,143.6 |
|
|
Initial Capex - Mining |
$M |
NA |
NA |
144.3 |
||
|
Initial Capex - Other |
$M |
NA |
NA |
999.4 |
||
|
Expansion Capex (excl.mining) |
$M |
277.3 |
415.9 |
693.2 |
||
|
Sustaining Capex |
$M |
324.8 |
953.0 |
1,277.8 |
||
|
Sustaining Capex - Mining |
$M |
268.4 |
429.6 |
698.0 |
||
|
Sustaining Capex - Tailings |
$M |
56.4 |
523.4 |
579.8 |
||
|
Closure Cost (20% of Initial + Expansion Capex) |
$M |
– |
367.4 |
367.4 |
||
|
Salvage Value (15% of Initial Capex Process Directs, Expansion Capex) |
$M |
– |
(171.4) |
(171.4) |
||
|
Initial CAPEX/total mill throughput |
$/t milled |
NA |
NA |
1.5 |
||
|
Sus CAPEX/total mill throughput |
$/t milled |
NA |
NA |
1.7 |
||
|
Initial Capex / avg annual Cu Eq. |
$/t CuEq |
NA |
NA |
16,216 |
||
|
Sus CAPEX / avg annual Cu Eq. |
$/t CuEq |
18,696 |
18,003 |
18,119 |
||
|
Pre-Tax Economics |
NPV (7%) |
$M |
NA |
NA |
3,419.20 |
|
|
IRR |
% |
NA |
NA |
35.4% |
||
|
Payback |
yr |
NA |
NA |
1.8 |
||
|
NPV/Initial Capital |
- |
NA |
NA |
3.0 |
||
|
Post-Tax Economics |
NPV (7%) |
$M |
NA |
NA |
1,996.4 |
|
|
IRR |
% |
NA |
NA |
28.6% |
||
|
Payback |
yr |
NA |
NA |
1.9 |
||
|
NPV/Initial Capital |
- |
NA |
NA |
1.7 |
||
|
* C1 costs consist of mining costs, processing costs, mine-level G&A and offsite charges |
|
|||||
|
** C3 includes cash costs plus royalties, sustaining capital, expansion capital, and closure costs |
|
|||||
|
*** AISC includes cash costs plus royalties, sustaining capital, and closure costs |
|
|||||
The 2025 PEA is preliminary in nature and includes inferred mineral resources that are considered too speculative geologically to have the economic considerations applied to them that would allow them to be categorized as mineral reserves and there is no certainty that the preliminary economic assessment will be realized. Mineral resources that are not mineral reserves do not have demonstrated economic viability.
All-in Sustaining Costs
The 2025 PEA outlines robust economics for the North Island Project during both phases with Phase 1 annual production of 200,000 ounces of gold and 48 million pounds of copper at an AISC of US$1.83/lb CuEq in Phase 1, growing to annual production of 81 million pounds of copper, 123,000 ounces of gold, 3 million lbs molybdenum and 5 tonnes of rhenium at an AISC of US$2.52/lb CuEq in Phase 2. The higher AISC in Phase 2 is mainly attributed to higher sustaining costs resulting from tailings storage development for lower grade ore and increased reagent usage for the gold leach in phase 2. Over the LOM, the 2025 PEA estimates an AISC of US$2.41/lb CuEq on payable production of 2,168 million pounds of copper, 3.9 million ounces of gold, 66 million lbs molybdenum and 124 tonnes of rhenium, which places the Project competitively on the global cost curve for primary copper projects (source: S&P Global Market Intelligence).
Selling Costs, Royalties and Taxes
Table 15: Selling Costs
|
Payability |
Units |
Value |
|
Cu in conc |
% |
96.50% |
|
Mo in conc |
% |
99.00% |
|
Au in conc |
% |
97.50% |
|
Au in dore |
% |
99.95% |
|
Re in conc |
% |
80.00% |
|
Offsite Charges |
||
|
Transport |
|
|
|
Cu Concentrate (Phase 1) |
$/wmt |
120 |
|
Mo Concentrate (Phase 1) |
$/wmt |
120 |
|
Cu Concentrate (Phase 2) |
$/wmt |
29 |
|
Mo Concentrate (Phase 2) |
$/wmt |
120 |
|
Treatment |
|
|
|
Cu Concentrate |
$/dmt |
70 |
|
Mo Concentrate |
$/dmt |
130 |
|
Refining |
|
|
|
Cu in conc |
$/lb |
0.07 |
|
Mo in conc |
$/lb |
1.25 |
|
Au in conc |
$/oz |
6.4 |
|
Au in dore |
$/oz |
6.6
|
Royalties
The 2025 PEA economics considers a private NSR royalty on the Red Dog deposit at 1% (with 2% repurchased for $2 million), and a private 10% net profit interest (NPI) royalty on portions of the Hushamu deposit.
Taxes
Key provincial and federal tax considerations for North Island include:
- British Columbia mining tax – 2% provincial minimum tax payable on operating profits immediately upon the start of production which is creditable against the 13% effective mining tax rate which is calculated based on operating profit less applicable capital cost deductions. The mining tax is deductible in computing provincial and federal income tax
- British Columbia provincial income tax – 12.0%, payable after applicable deductions are used
- Canadian federal income tax – 15.0%, payable after applicable deductions are used
- BC Output Based Pricing System for carbon taxes
Qualified Persons and Data Verification
Ian Chang, P.Eng., Vice President Project Development of Northisle, and a Qualified Person as defined by National Instrument 43-101, has reviewed and approved the scientific and technical disclosure contained in this news release.
Additionally, a team of independent Qualified Persons (as such term is defined under NI 43-101) at Ausenco, and Moose Mountain Technical Service, and SLR are responsible for the 2025 PEA and have reviewed the scientific and technical disclosure, and verified the data in this press release, including:
- Peter Mehrfert, P.Eng., of Ausenco is an independent Qualified Person responsible for process and recovery methods, infrastructure, market studies, contracts and economic analysis in the PEA.
- Ali Hooshiar, P.Eng., of Ausenco is an independent Qualified Person responsible for mine waste storage facilities in the PEA.
- Marc Schulte P.Eng., of MMTS is an independent Qualified Person responsible for the open pit design, mine production schedule, waste rock storage facility and mine capital and operating cost estimates in the PEA.
- Sue Bird, P.Eng., of MMTS is an independent Qualified Person responsible for development of the Resource Estimate and completed the work related to the geological setting, deposit type, drilling, exploration work, sample preparation and analysis in the PEA.
- Stephan Theban, P.Eng., of SLR is an independent Qualified Person responsible for the environmental and permitting studies.
About Northisle
Northisle Copper and Gold Inc. is a Vancouver-based company whose mission is to become Canada’s leading sustainable mineral resource company for the future. Northisle, through its 100% owned subsidiary North Island Mining Corp., owns the North Island Project, which is one of the most promising copper and gold porphyry projects in Canada. The North Island Project is located near Port Hardy, British Columbia on a more than 34,000-hectare block of mineral titles 100% owned by Northisle stretching 50 kilometers northwest from the now closed Island Copper Mine operated by BHP Billiton. Since 2021, the Company has discovered two significant deposits, expanded resources, demonstrated the economic potential of the project, and is now focused on accelerating the advancement of this compelling project while exploring within this highly prospective land package.
For more information on Northisle please visit the Company’s website at www.northisle.ca .
About Ausenco
Ausenco is a global company redefining what's possible. The team is based across 26 offices in 15 countries delivering services worldwide. Combining deep technical expertise with a 30-year track record, Ausenco delivers innovative, value-add consulting studies, project delivery, asset operations and maintenance solutions to the minerals and metals and industrial sectors ( www.ausenco.com ).
Cautionary Statements regarding Forward-Looking Information
Certain information in this news release constitutes forward-looking statements under applicable securities law. Any statements that are contained in this news release that are not statements of historical fact may be deemed to be forward-looking statements. Forward-looking statements are often identified by terms such as “may”, “should”, “anticipate”, “expect”, “intend” and similar expressions. Forward-looking statements in this news release include, but are not limited to, statements relating to the 2024 Resource Estimate; plans and expectations regarding the 2025 exploration program; plans and expectations regarding future project development; growth potential and future financial or operating performance; timing of key catalysts; planned activities, including further drilling, at the North Island Project; anticipated mine life and exploration potential and activities at the North Island Project; timing and movement, if any, from Phase 1 into Phase 2; Northisle’s ability to secure the permits and authorizations needed to construct and operate the North Island Project in a timely manner, if at all; plans and timing surrounding current and future baseline studies; ongoing support of the key stakeholders, including Quatsino, the Tlatlasikwala and the Kwakiutl; and the Company’s plans for advancement of the North Island Project. Forward-looking statements necessarily involve known and unknown risks, including, without limitation, Northisle’s ability to implement its business strategies; risks associated with mineral exploration and production; risks associated with general economic conditions; adverse industry events; stakeholder engagement; marketing and transportation costs; loss of markets; volatility of commodity prices; inability to access sufficient capital from internal and external sources, and/or inability to access sufficient capital on favourable terms; industry and government regulation; changes in legislation, income tax and regulatory matters; competition; currency and interest rate fluctuations; and other risks. Readers are cautioned that the foregoing list is not exhaustive.
Readers are further cautioned not to place undue reliance on forward-looking statements as there can be no assurance that the plans, intentions, or expectations upon which they are placed will occur. Such information, although considered reasonable by management at the time of preparation, may prove to be incorrect and actual results may differ materially from those anticipated. Forward-looking statements contained in this news release are expressly qualified by this cautionary statement.
The forward-looking statements contained in this news release represent the expectations of management of Northisle as of the date of this news release, and, accordingly, are subject to change after such date. Northisle does not undertake any obligation to update or revise any forward-looking statements, whether as a result of new information, future events or otherwise, except as expressly required by applicable securities law.
Neither the TSX Venture Exchange nor its Regulation Services Provider (as that term is defined in the policies of the TSX Venture Exchange) accepts responsibility for the adequacy or accuracy of this news release.
i
S&P Capital IQ Pro (2025). 2024 Modeled Cost + Production - Copper. Total Cash Cost includes onsite operating costs (including labour, energy, reagents), TCRC + shipping costs and royalties.
ii
Source: S&P Capital IQ Pro (2025). Mine Emission. Commodity: Copper. Retrieved from S&P Global Market Intelligence platform.
View source version on businesswire.com: https://www.businesswire.com/news/home/20250219753267/en/
On behalf of Northisle Copper and Gold Inc.
Nicholas Van Dyk, CFA
Chief Financial Officer
Tel: (604) 335-3590
Email:
info@northisle.ca
www.northisle.ca
